IMAGE

Figure 4

ID
ZDB-IMAGE-200619-9
Source
Figures for Cao et al., 2020
Image
Figure Caption

Figure 4

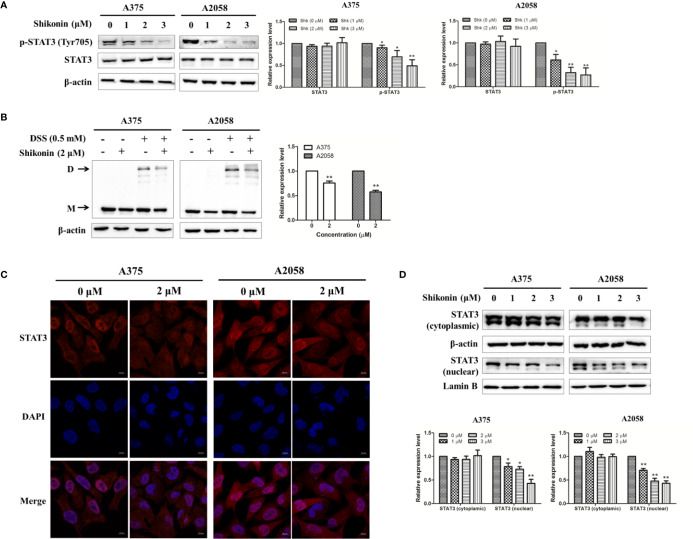
Shikonin inhibited STAT3 signaling pathway in melanoma cells. (A) Cells were treated with indicated concentration of shikonin for 24 h, expression levels of STAT3 and p-STAT3 were determined by the Western blot analysis (upper), and relative expression levels were analyzed by Image J software (bottom). (B) Cells were treated with 2 μM shikonin for 24 h, and then incubated with DSS. Changes in STAT3 dimerization were evaluated by immunoblotting. The arrows indicated the dimer (D) and the monomer (M) STAT3. The representative results (upper) and the relative expression levels of dimer STAT3 (bottom) were shown. (C, D) Cells were treated with indicated concentration of shikonin for 24 h, and then the intracellular distribution of STAT3 was analyzed by immunofluorescence assay (C) and immunoblotting (D). Relative expression levels of cytosolic and nuclear STAT3 were also shown (bottom). Data were shown as mean ± SD from three independent experiments, *P < 0.05 and **P < 0.01.

Acknowledgments
This image is the copyrighted work of the attributed author or publisher, and ZFIN has permission only to display this image to its users. Additional permissions should be obtained from the applicable author or publisher of the image. Full text @ Front Pharmacol