
- Title
-
Triploidy in zebrafish larvae: Effects on gene expression, cell size and cell number, growth, development and swimming performance
- Authors
- van de Pol, I.L.E., Flik, G., Verberk, W.C.E.P.
- Source
- Full text @ PLoS One

A) Exemplary DNA histogram of two diploid larvae pooled in one sample. Standard size G1-peak = 1.44 pg, estimated size G2-peak = 2.85 pg, ratio G2 / G1 = 1.98, RCS value = 6.96. B) Exemplary DNA histogram of one diploid and one triploid larva pooled in one sample. Standard size G1-peak 2n = 1.44 pg, estimated size G1-peak 3n = 2.15 pg, ratio G1-3n / G1-2n = 1.49, RCS value = 2.11. In both A) and B) the dashed grey line is the initial model estimate and the red line is the fitted model. Colored circles represent matching cell cycle phases derived from a diploid or triploid larva. Peaks C, D, and E represent endopolyploid cell populations. |
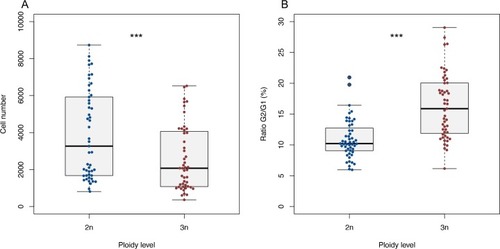
A) Cell number of diploid and triploid larvae in pooled FCM samples. Paired |
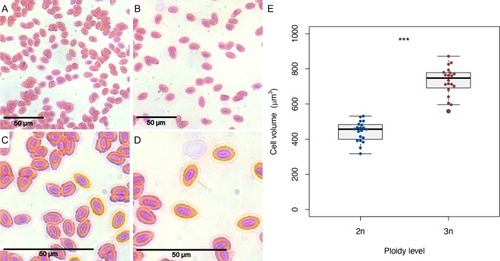
A) Microscopic picture of diploid erythrocytes (40x). B) Microscopic picture of triploid erythrocytes (40x). C) Zoomed in version of picture A, showing automatic cell area detection of diploid cells. D) Zoomed in version of picture B, showing automatic cell area detection of triploid cells. Note that only non-touching cells are analysed. E) Estimated cell volumes of diploid and triploid erythrocytes. Two sample |
A) |
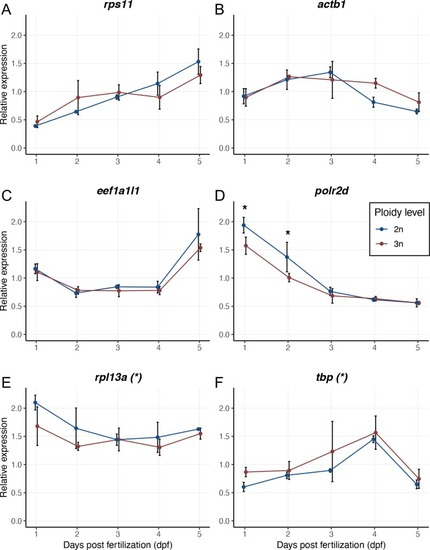
Expression values are normalized using a combined index of the relative quantity of the housekeeping genes |
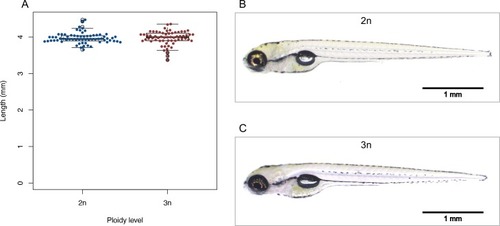
A) Body length of diploid and triploid larvae. Two sample |

A) Development of diploid larvae, n = 82. B) Development of triploid larvae, n = 55. In both A) and B) the dashed grey line is the reference x = y. Solid grey lines are the hours post fertilization at which the embryos and larvae were staged, namely: 6, 24, 30, 48 and 72 hours. ANOVA, |
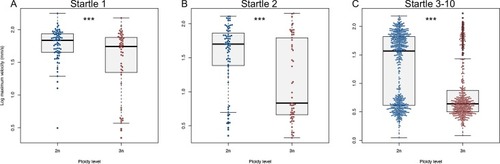
A) Swimming velocity of diploid and triploid larvae at the first startle stimulus. B) Swimming velocity of diploid and triploid larvae at the second startle stimulus. C) Swimming velocity of diploid and triploid larvae at the third to tenth startle stimulus. ANOVA, *** |