
FIGURE
Fig 5
- ID
- ZDB-FIG-200314-22
- Publication
- van de Pol et al., 2020 - Triploidy in zebrafish larvae: Effects on gene expression, cell size and cell number, growth, development and swimming performance
- Other Figures
- All Figure Page
- Back to All Figure Page
Fig 5
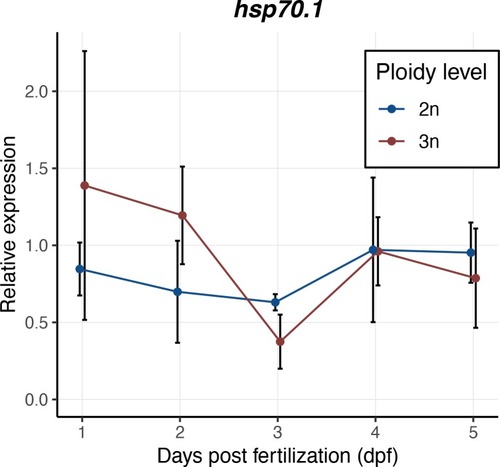
Expression values are normalized using a combined index of the relative quantity of the housekeeping genes |
Expression Data
Expression Detail
Antibody Labeling
Phenotype Data
Phenotype Detail
Acknowledgments
This image is the copyrighted work of the attributed author or publisher, and
ZFIN has permission only to display this image to its users.
Additional permissions should be obtained from the applicable author or publisher of the image.
Full text @ PLoS One