
Image
|
Figure Caption
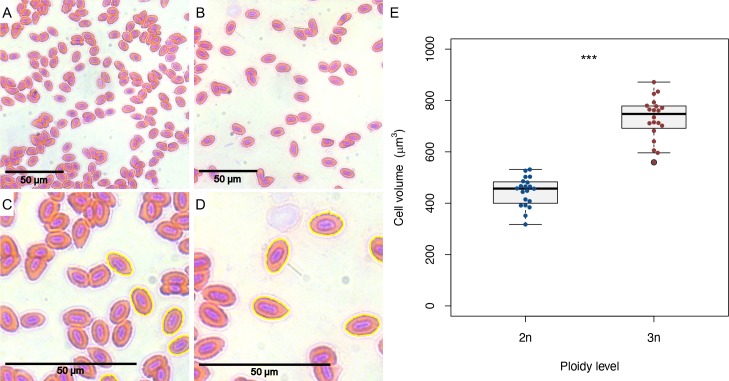
Fig 3
A) Microscopic picture of diploid erythrocytes (40x). B) Microscopic picture of triploid erythrocytes (40x). C) Zoomed in version of picture A, showing automatic cell area detection of diploid cells. D) Zoomed in version of picture B, showing automatic cell area detection of triploid cells. Note that only non-touching cells are analysed. E) Estimated cell volumes of diploid and triploid erythrocytes. Two sample
Acknowledgments
This image is the copyrighted work of the attributed author or publisher, and
ZFIN has permission only to display this image to its users.
Additional permissions should be obtained from the applicable author or publisher of the image.
Full text @ PLoS One