
- Title
-
Systematic genome editing of the genes on zebrafish Chromosome 1 by CRISPR/Cas9
- Authors
- Sun, Y., Zhang, B., Luo, L., Shi, D.L., Wang, H., Cui, Z., Huang, H., Cao, Y., Shu, X., Zhang, W., Zhou, J., Li, Y., Du, J., Zhao, Q., Chen, J., Zhong, H., Zhong, T.P., Li, L., Xiong, J.W., Peng, J., Xiao, W., Zhang, J., Yao, J., Yin, Z., Mo, X., Peng, G., Zhu, J., Chen, Y., Zhou, Y., Liu, D., Pan, W., Zhang, Y., Ruan, H., Liu, F., Zhu, Z., Meng, A., ZAKOC Consortium
- Source
- Full text @ Genome Res.
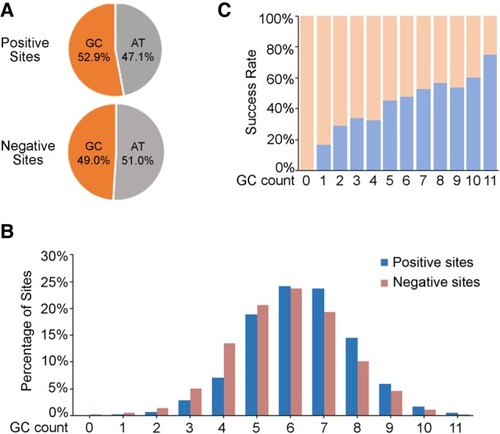
GC-content distribution in the 12-nt seed sequence of all the tested target sites (including 1086 positive sites and 1191 negative sites). ( |
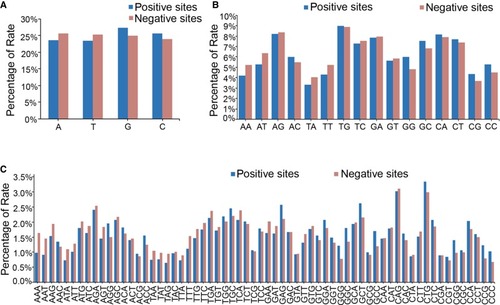
Distribution of nucleotide motifs in the 12-nt seed region of all the tested target sites. (A) The statistical data showing the distribution of each single nucleotide in the seed region of the target sites. (B) The statistical data showing the distribution of 2-nt motifs in the seed region of the target sites. (C) The statistical data showing the distribution of 3-nt motifs in the seed region of the target sites. |
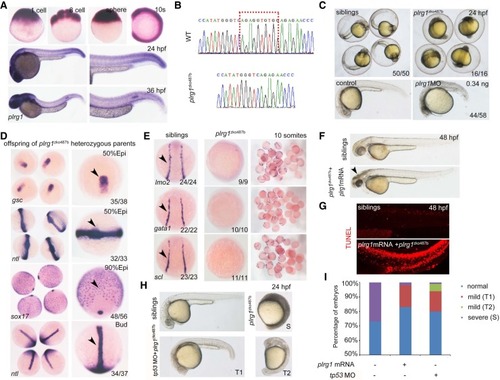
Characterization of plrg1 mutant generated by the CRISPR/Cas9 system. (A) Whole-mount in situ hybridization (WISH) showing the expression of plrg1 at different developmental time points from the one-cell stage to 36 h postfertilization (hpf). (B) The comparison of genomic DNA sequences between wild type (WT) and plrg1 mutants with 10-base pair deletion. (C) The plrg1 mutants and morphants showed severe developmental defects, with black head and small body compared to the siblings and control embryos, respectively, at 24 hpf. (D) WISH showing the expression of gsc and ntl at the 50% epiboly stage, sox17 at 90% epiboly stage, and ntl at bud stage in the offspring of plrg1 heterozygous parents. The right panels show the magnified images, and the black arrowheads indicate corresponding expression of gsc at the dorsal margin, ntl at anterior axial hypoblast, forerunner cell group, and margin, and sox17 at endoderm and forerunner cells. (E) WISH showing the expression of lmo2, gata1, and scl at lateral plate mesoderm in the siblings and plrg1 mutants. (F) Overexpression of the plrg1 full-length mRNA can rescue plrg1 mutants until 4 dpf. The body defects of mutants were rescued efficiently by mRNA overexpression, but there is still a black head at 48 hpf (arrowhead) in plrg1 mutants. (G) TUNEL assay displays that there are obvious apoptotic signals at 48 hpf in plrg1 mutants injected with plrg1 mRNA. (H) Injection of tp53 morpholino can rescue the developmentally defective phenotype of plrg1 mutants efficiently at 24 hpf. There are three subtypes of defective embryos, and we describe the siblings as normal, plrg1 mutants as severe (S), and partial rescued mutants as mild (T1) and mild (T2). (I) The quantification of plrg1 mutant embryos in different treatment groups shown in H. |
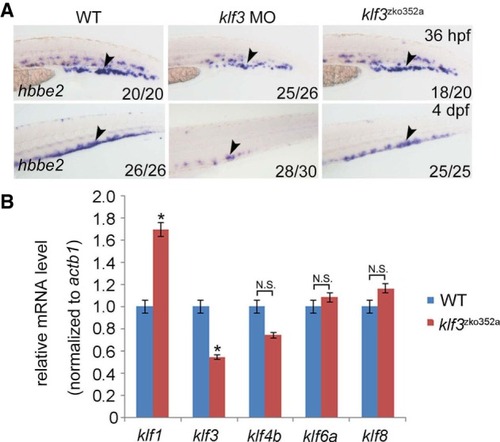
Phenotypic comparison between |