
Image
|
Figure Caption
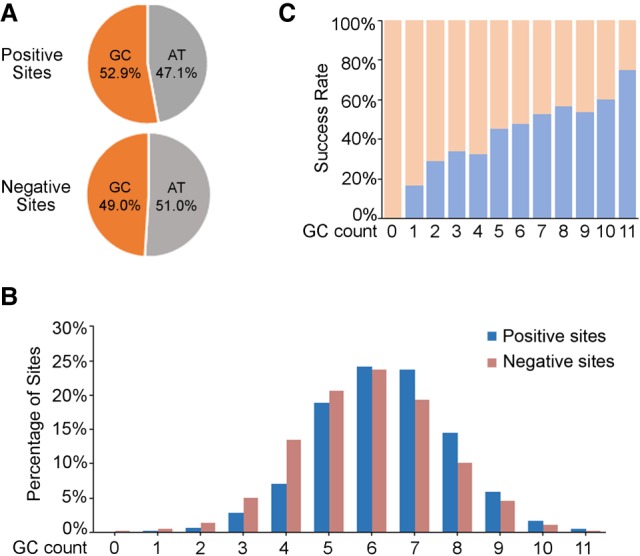
Figure 1.
GC-content distribution in the 12-nt seed sequence of all the tested target sites (including 1086 positive sites and 1191 negative sites). (
Acknowledgments
This image is the copyrighted work of the attributed author or publisher, and
ZFIN has permission only to display this image to its users.
Additional permissions should be obtained from the applicable author or publisher of the image.
Full text @ Genome Res.