
Image
|
Figure Caption
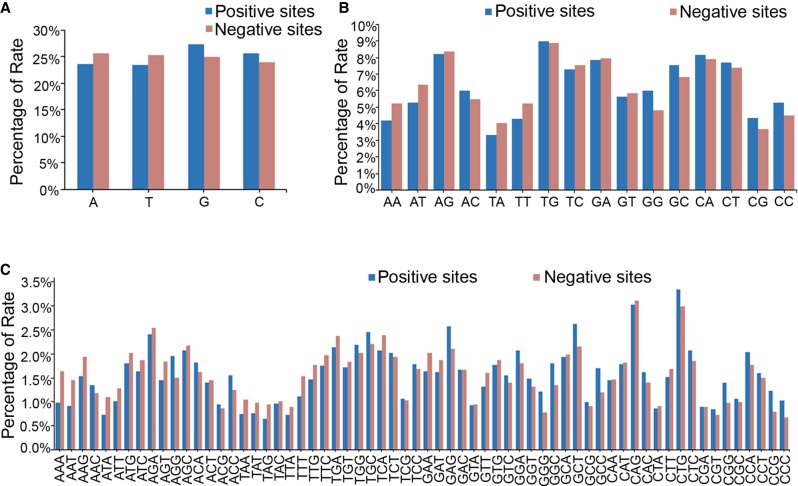
Figure 2. Distribution of nucleotide motifs in the 12-nt seed region of all the tested target sites. (A) The statistical data showing the distribution of each single nucleotide in the seed region of the target sites. (B) The statistical data showing the distribution of 2-nt motifs in the seed region of the target sites. (C) The statistical data showing the distribution of 3-nt motifs in the seed region of the target sites.
Acknowledgments
This image is the copyrighted work of the attributed author or publisher, and
ZFIN has permission only to display this image to its users.
Additional permissions should be obtained from the applicable author or publisher of the image.
Full text @ Genome Res.