
- Title
-
Fenestrae-associated protein Plvap regulates the rate of blood-borne proteins passage into the hypophysis
- Authors
- Gordon, L., Blechman, J., Shimoni, E., Gur, D., Anand-Apte, B., Levkowitz, G.
- Source
- Full text @ Development
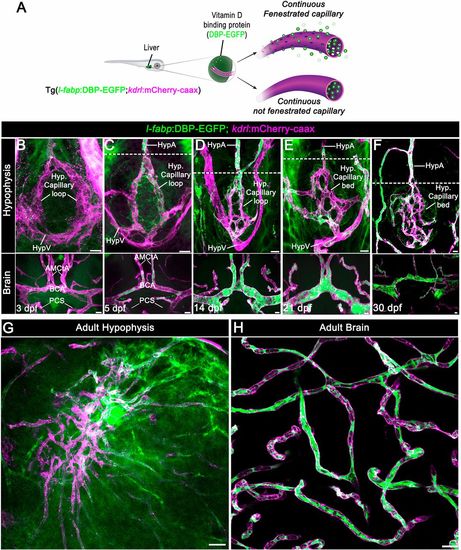
Zebrafish neurohypophyseal vasculature is permeable to blood-borne proteins. (A) Scheme describing an endogenous biosensor for real-time monitoring of vascular permeability. Vitamin D-binding protein (DBP) fused to EGFP, expressed in hepatocytes under a liver-specific promoter (l-fabp) and secreted into the general circulation, served as permeability biosensor. (B-F) Wholemounts of double transgenic Tg(l-fabp:DBP-EGFP;kdrl:mCherry-caax) zebrafish at different developmental stages demonstrating extravasation of DBP-EGFP in the pituitary (top) but not in the brain (bottom). A functional permeability boundary is established between the capillary loop and hypophyseal artery (dotted lines). Scale bars: 5 µm. (G,H) Wholemounts of double transgenic Tg(l-fabp:DBP-EGFP;kdrl:mCherry-caax) adult zebrafish hypophysis (G) and brain (H) vasculature. Scale bars: 20 µm. AMCtA, anterior (rostral) mesencephalic central artery; BCA, basal communicating artery; HypA, hypophyseal artery; HypV, hypophyseal vein; PCS, posterior (caudal) communicating segment. EXPRESSION / LABELING:
|
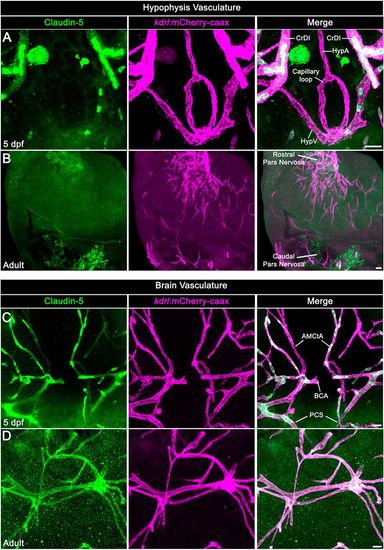
Neurohypophyseal vasculature is devoid of the BBB marker protein claudin 5. (A,B) Claudin 5 expression in hypophyseal vessels of 5 dpf larvae (A) or adult (B) was detected by whole-mount immunofluorescence staining using anti-claudin 5 antibody. Tg(kdrl:mCherry-caax) zebrafish. (C,D) Claudin 5 expression in brain vasculature was detected by whole-mount immunofluorescence staining using anti-claudin 5 antibody in 5 dpf larvae (C) or adult (D) Tg(kdrl:mCherry-caax) zebrafish. AMCtA, anterior (rostral) mesencephalic central artery; BCA, basal communicating artery; CrDI, cranial division of the internal carotid artery; HypA, hypophyseal artery; HypV, hypophyseal vein; PCS, posterior (caudal) communicating segment. Scale bars: 5 µm in A,C; 20 µm in B,D. EXPRESSION / LABELING:
|
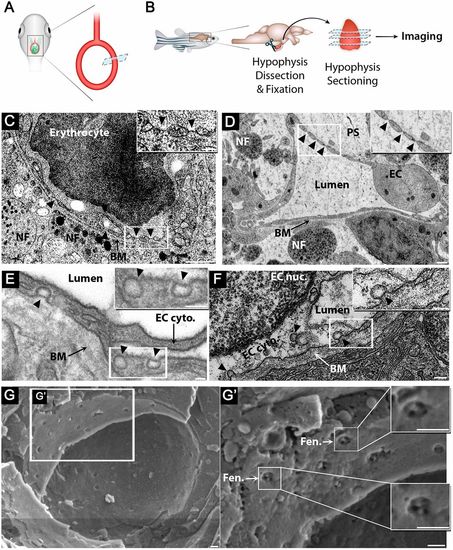
Zebrafish hypophyseal endothelia contain diaphragmed fenestrae and caveolae. (A) Scheme describing TEM imaging of the hypophyseal capillary in zebrafish larvae. The hypophyseal oxtl:EGFP reporter was used as an anatomical landmark to localize the position of larval hypophysis prior to tissue preparation for TEM imaging. (B) Scheme describing TEM imaging of adult zebrafish hypophysis. Multiple ultrathin sections (60-80 nm) of the dissected hypophysis from adult zebrafish were submitted to TEM imaging. (C,D) TEM imaging of cross-section of larval (5 dpf) (C) and adult (D) showing hypophyseal fenestrated capillary contacting hypothalamic axonal nerve fibers (NF). Scale bars: 500 nm in C; 200 nm in D. Insets show higher magnification of diaphragmed fenestrae organized in a sieve-like manner. Fenestrae are indicated by arrowheads. Scale bars: 100 nm. (E,F) TEM imaging of hypophyseal endothelia containing abluminal, luminal and internalized caveolae indicated by arrowheads. Scale bars: 100 nm. Insets show higher magnification of internalized and surface caveolae with stomatal diaphragm. Scale bars: 100 nm. (G) Cryo-SEM imaging of fenestrated endothelia in adult zebrafish hypophysis. Higher magnifications (G′) of the hypophyseal fenestrated endothelial cell show the surface view of the fenestral diaphragm dissected into several openings by fibrils that converge at the center of the pore (insets). BM, basement membrane; EC, endothelial cell; EC cyto., endothelial cell cytoplasm; EC nuc., endothelial cell nucleus; Fen., fenestrae; NF, nerve fiber; PS, perivascular space. See related Fig. S1. |
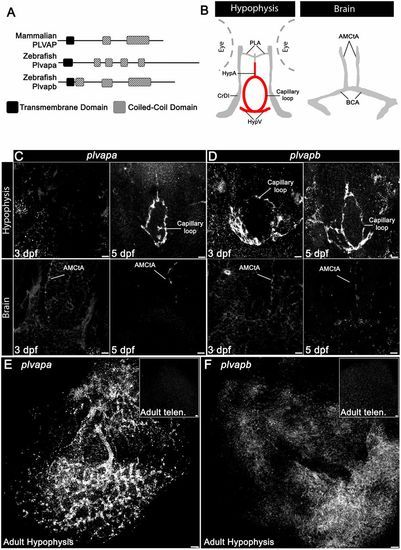
Developmental expression of Plvap orthologs in the hypophyseal vasculature. (A) Schematic representation of the predicted secondary structure of zebrafish (Plvapa and Plvapb) and mammalian (PLVAP) proteins. (B) A scheme describing the major vasculature of the larval hypophysis and brain. (C,D) Whole-mount fluorescence in situ hybridization of zebrafish larvae at 3 or 5 dpf showing restricted plvapa (C) and plvapb (D) mRNA expression in the hypophyseal but not in the brain vasculature. Scale bars: 5 µm. (E,F) Whole-mount FISH of adult zebrafish showing restricted plvapa (E) and plvapb (F) mRNA expression in the hypophyseal but not in the brain vasculature. Scale bars: 20 µm. AMCtA, anterior (rostral) mesencephalic central artery; BCA, basal communicating artery; CrDI, cranial division of the internal carotid artery; HypA, hypophyseal artery; HypV, hypophyseal vein; PLA, palatocerebral artery. See related Figs S2 and S3. EXPRESSION / LABELING:
|
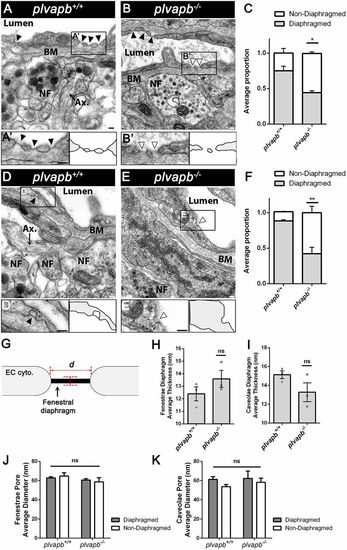
Ultrastructural analysis of fenestral and stomatal diaphragms in wild-type versus plvapb−/− zebrafish hypophyseal endothelium. (A,B) TEM imaging of diaphragmed (black arrowheads) and non-diaphragmed (white arrowheads) fenestrae in the adult zebrafish hypophysis. (A′,B′). Higher magnification and graphical depiction of diaphragmed and non-diaphragmed fenestrae. (C) Graph showing the proportion of diaphragmed and non-diaphragmed fenestrae in the plvapb+/+ versus plvapb−/− mutant fish. The proportion of diaphragmed and non-diaphragmed fenestrae was calculated in each blood capillary (5-25 capillaries per each biological repeat). The collated data of multiple capillaries measurements in each fish was averaged and plotted for each genotype. The proportion of complete diaphragms was significantly decreased in the mutant fish (*P<0.05; Welch two-sample t-test, n=3 for each genotype). (D,E) TEM imaging of diaphragmed (black arrowheads) and non-diaphragmed (white arrowheads) caveolae in the adult zebrafish hypophysis. (D′,E′) Higher magnification and graphical depiction of diaphragmed and non-diaphragmed caveolae. (F) Graph showing the proportion of diaphragmed and non-diaphragmed caveolae in the plvapb+/+ versus plvapb−/− mutant fish. The proportion of diaphragmed and non-diaphragmed fenestrae was calculated as in C. The proportion of complete stomatal diaphragms was significantly decreased in the mutant fish (**P<0.01; Welch two-sample t-test, n=3 for each genotype). (G-K) Quantitative analyses the morphological parameters of fenestral and caveolar diaphragms in the wild type versus plvapb−/− mutant. The collated data of 5-25 blood capillaries in each biological repeat was averaged and plotted for each genotype. (G) Scheme describing how the diaphragm thickness and pore diameter of fenestrae and caveolae were measured. (H,I) Graphs showing mean fenestral (H) and caveolar (I) diaphragm thickness. No significant difference were found between plvapb+/+ and plvapb−/− fish (ns, not significant; Welch two-sample t-test, n=3 for each genotype). (J,K) Graphs showing mean fenestral (J) and caveolar (K) pore diameter. No significant difference in the diameter of either diaphragmed or non-diaphragmed fenestral and caveolar openings was found between the plvapb+/+ and plvapb−/− fish (ns=not significant; two-way ANOVA, n=3 for each genotype). Data are presented as mean±s.e.m.; individual data points are shown in H and I. Ax., axonal element; BM, basement membrane; NF, nerve fiber. Scale bars: 100 nm. See related Figs S4, S5, S6 and S7. PHENOTYPE:
|

Mutation in plvapb leads to increased density of fenestrae but not caveolae. (A,B) Representative TEM images of endothelial cells of the adult zebrafish hypophyses, showing the increased number of fenestrae (arrowheads) along the endothelium in the plvapb−/− mutant fish. Scale bars: 500 nm. (C,D) Representative TEM images of endothelial cells of adult zebrafish hypophyses showing multiple caveolae (arrowheads) along the endothelial wall. Scale bars: 100 nm. (E,F) Quantification of the linear density of diaphragmed and non-diaphragmed fenestrae (E) and caveolae (F) per length unit of endothelium. The number of these structures was counted and the endothelial cell length was measured within each blood capillary (5-25 blood capillaries per biological repeat). The density was calculated as the number of fenestrae and caveolae divided by endothelial wall length (nm). The density then was multiplied by 104 to represent the result as density per 10 µm of endothelial wall. A significant increase in the linear density of the diaphragmed and non-diaphragmed fenestrae, but not caveolae, was observed in the plvapb−/− mutants (***P<0.001, ns, not significant; two-way ANOVA, n=3 for each genotype). Data are mean±s.e.m. See related Fig. S7. PHENOTYPE:
|

Plvapb limits the transfer rate of blood-borne proteins into the hypophysis parenchyma. (A) Confocal maximal intensity images showing the hypophyseal capillary loop in plvapb+/+ and plvapb−/− double transgenic Tg(l-fabp:DBP-EGFP;kdrl:mCherry-caax) zebrafish larvae (5 dpf). Scale bars: 10 µm. (B,C) Morphological analysis of hypophyseal capillary loop parameters, including roundness index [width (x)/length (y)] (B) and area (C). No significant differences were found between plvapb+/+ (n=18) and plvapb−/− (n=23) fish (ns, not significant; Student's t-test). (D) Quantification of accumulated fluorescence intensity of the extravasated DBP-EGFP inside the hypophyseal capillary loop (dashed line in A, left panel) of fixed plvapb+/+ (n=16) and plvapb−/− (n=23) larvae. No significant difference was found between the fish (ns, not significant; Student's t-test). (E) Schematic representation of the fluorescence recovery after photobleaching (FRAP) of extravasated DBP-EGFP in the hypophysis of live zebrafish larval. ROI, region of interest. (F) Real-time FRAP measurements of the intensity of extravasated DBP-EGFP signal in live plvapb+/+ (n=8) and plvapb−/− (n=10) transgenic Tg(l-fabp:DBP-EGFP;kdrl:mCherry-caax) larvae (4 dpf). (G) T1/2 of the fluorescence recovery after bleaching of DBP-EGFP. T1/2 value (calculated using ImageJ FRAP Profiler tool) is significantly lower in the plvapb−/− mutant, indicating higher extravasation rate of blood-borne protein in mutant versus wild-type fish (*P<0.05; Student's t-test). a.u., arbitrary units. Data are mean±s.e.m. |