
|
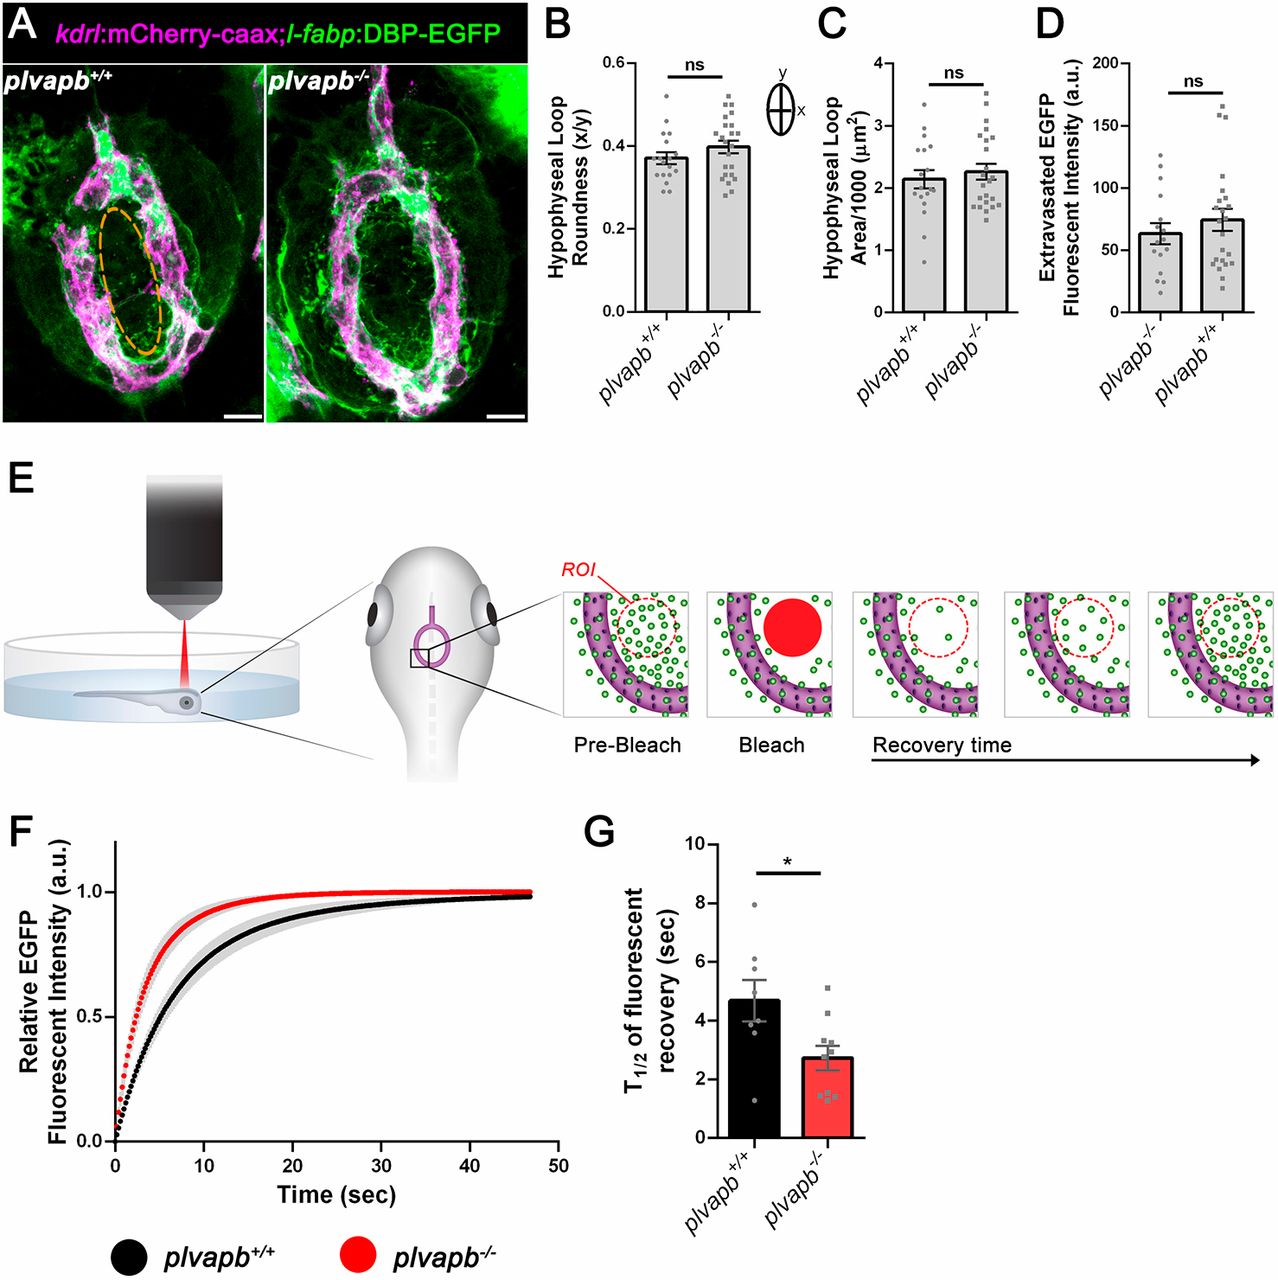
Fig. 7 Plvapb limits the transfer rate of blood-borne proteins into the hypophysis parenchyma. (A) Confocal maximal intensity images showing the hypophyseal capillary loop in plvapb+/+ and plvapb−/− double transgenic Tg(l-fabp:DBP-EGFP;kdrl:mCherry-caax) zebrafish larvae (5 dpf). Scale bars: 10 µm. (B,C) Morphological analysis of hypophyseal capillary loop parameters, including roundness index [width (x)/length (y)] (B) and area (C). No significant differences were found between plvapb+/+ (n=18) and plvapb−/− (n=23) fish (ns, not significant; Student's t-test). (D) Quantification of accumulated fluorescence intensity of the extravasated DBP-EGFP inside the hypophyseal capillary loop (dashed line in A, left panel) of fixed plvapb+/+ (n=16) and plvapb−/− (n=23) larvae. No significant difference was found between the fish (ns, not significant; Student's t-test). (E) Schematic representation of the fluorescence recovery after photobleaching (FRAP) of extravasated DBP-EGFP in the hypophysis of live zebrafish larval. ROI, region of interest. (F) Real-time FRAP measurements of the intensity of extravasated DBP-EGFP signal in live plvapb+/+ (n=8) and plvapb−/− (n=10) transgenic Tg(l-fabp:DBP-EGFP;kdrl:mCherry-caax) larvae (4 dpf). (G) T1/2 of the fluorescence recovery after bleaching of DBP-EGFP. T1/2 value (calculated using ImageJ FRAP Profiler tool) is significantly lower in the plvapb−/− mutant, indicating higher extravasation rate of blood-borne protein in mutant versus wild-type fish (*P<0.05; Student's t-test). a.u., arbitrary units. Data are mean±s.e.m.