
- Title
-
Zebrafish modeling of intestinal injury, bacterial exposures, and medications defines epithelial in vivo responses relevant to human inflammatory bowel disease
- Authors
- Chuang, L.S., Morrison, J., Hsu, N.Y., Labrias, P.R., Nayar, S., Chen, E., Villaverde, N., Facey, J.A., Boschetti, G., Giri, M., Castillo-Martin, M., Thin, T.H., Sharma, Y., Chu, J., Cho, J.H.
- Source
- Full text @ Dis. Model. Mech.
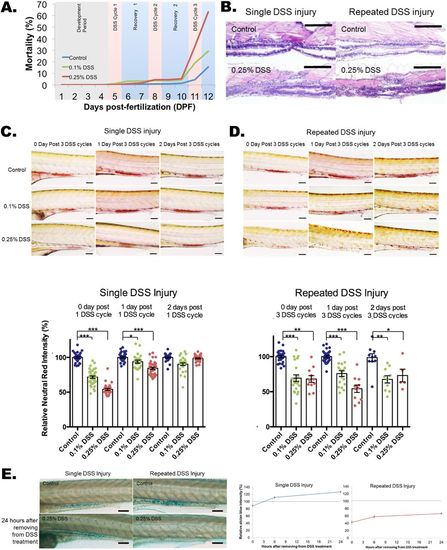
Impaired recovery of acidic-lysosome function and mucin production after repeated DSS injury in zebrafish intestines. (A) Dose-dependent mortality observed after repeated DSS injury (N=1739 from 11 clutches). Compared to the single DSS injury, which has a 98-100% survival rate (day 6), repeated DSS injury induces a high mortality rate of 63% in 0.25% DSS and 29% in 0.1% DSS. (B) Hematoxylin and eosin (H&E) staining of a longitudinal section of zebrafish larvae intestine. A total of 20 larvae per experimental condition were embedded in paraffin and sectioned at 10 μm per slide. Scale bars: 100 μm. (C,D) Quantification of Neutral Red images (top panels) and Neutral Red accumulation (bottom panel) for single (C) and repeated (D) DSS-injured zebrafish. Neutral Red accumulation in the intestine indicates normally functioning acidic lysosomes. The damage to lysosomal function is fully recovered within 2 days with the single DSS injury (C; N=253 from four clutches) but is impaired with the repeated DSS injury (D; N=137 from three clutches; day 2 N=5 out of 13 from single clutch due to high mortality rate of 61.5%). Neutral Red images for single (C) and repeated (D) injury are shown as control, and 0.1% and 0.25% (w/v) DSS treatments at treatment times of 1 day and 2 days after injury. Scale bars: 100 µm. ***P<0.001, **P<0.01, *P<0.05. Error bars, mean±s.e.m. (E) Images (left panel) and quantification (right panel) of Alcian Blue staining of intestine with single and repeated injury with control and 24 h after removal from DSS treatment. The quantification of total Alcian Blue intensity from single (N=160 from three clutches) and repeated (N=154 from three clutches) injury is shown. There was an increase in mucin production after single DSS injury, but mucin production was impaired after repeated DSS injury. Scale bars: 100 µm. |
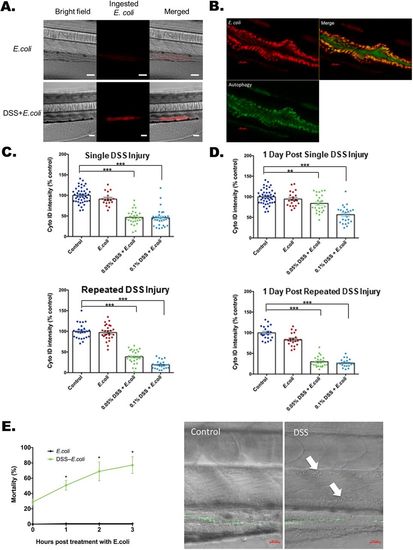
Lysosome-rich enterocyte-mediated bacterial protein uptake and autophagy with injury and bacterial exposure. (A) Bright-field, fluorescent and merged images of pHrodo-labeled heat-killed E. coli K12 MG1655 within a zebrafish larval intestine with and without DSS treatment. A total of 20 larva from each experimental condition were treated with the pHrodo-labeled E. coliproteins. The pHrodo dye is a pH-sensing dye indicating ingested E. coli proteins. Scale bars: 50 μm. The quantification is shown at the 0 h time point of Fig. 3G. (B) Uptake of E. coli proteins (red) colocalized with Cyto-ID-positive autophagosomes (green) in intestine. Scale bars: 20 μm. (C) Quantification of Cyto-ID intensities immediately following single (top panel) and repeated DSS injury (bottom panel). DSS [0.05% and 0.1% (w/v)] was applied at the beginning of treatment. ***P<0.001. Error bar, mean±s.e.m. (D) Cyto-ID intensities measured 1 day after DSS treatment shows recovery and non-recovery after single (top panel) and repeated (bottom panel) DSS injury. Altogether for C and D, N=544 from six clutches. ***P<0.001. **P<0.01. Error bar, mean±s.e.m. (E) High levels of mortality with E. coli treatment following single DSS injury. The left panel plots mortality rates at 1, 2 and 3 h after exposure to heat-killed E. coli labeled with Alexa Fluor 488 (green fluorescence) following single DSS injury. *P<0.05, comparing mortality rates at each time point with and without DSS treatment. N=341 from three clutches. Error bar, mean±s.e.m. The right panel shows systemic penetration of E. coli in the dorsal aorta (upper arrow) and posterior cardinal vein (lower arrow) with DSS treatment imaged 90 min after heat-killed E. coli treatment. Scale bars: 20 µm. Full bacterial invasion videos are shown in Movies 6 and 7. |
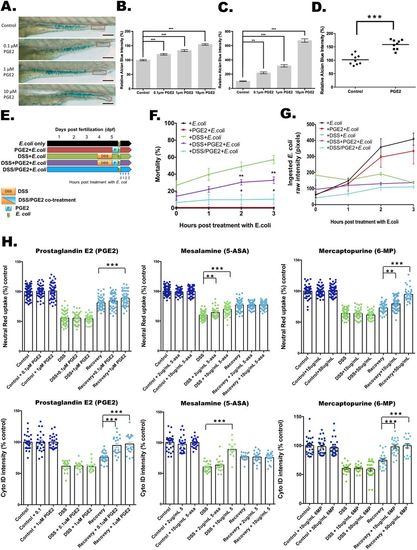
Effects of PGE2 and commonly utilized IBD medications on barrier function, bacterial containment and LRE function. (A-C) PGE2 induces mucin expression and release in a dose-dependent manner. (A) The images of Alcian Blue staining with treatments of 0.1, 1 and 10 μM PGE2. The quantification of the whole gut region is shown in B, and the red boxes indicate the quantification areas in C. Scale bars: 100 μm. Alcian Blue intensities of the full intestine (B) and the intestinal lumen (C) are shown (N=100 from three clutches). **P<0.01. ***P<0.001. Error bar, mean±s.e.m. (D) Quantification of relative Alcian Blue intensity in a human enteroid differentiated epithelial monolayer with and without 1 μM PGE2 treatment. ***P<0.001. N=3 patients with three biopsies each. (E-G) Experiment design of DSS and PGE2 treatment (E) for mortality assays (F) or ingested pHrodo-labeled E. coli protein intensity (G). *P<0.05. **P<0.01. N=1145 from nine clutches. Error bar, mean±s.e.m. (G) Fluorescent intensity of ingested pHrodo-labeled E. coli proteins 1, 2 and 3 h after removal from DSS. N=240 from three clutches. Error bar, mean±s.e.m. (H) Applying PGE2 (left panels), mesalamine (middle panels) and 6-mercaptopurine (right panels) to the DSS injury model. The relative Neutral Red (top panels) and Cyto-ID (bottom panels) intensities with treatment alone (dark blue), with treatment during DSS injury for 24 h (light green) and with 5 h of treatment after DSS removal (light blue) are reported relative to untreated controls. **P<0.01. ***P<0.001. Neutral-Red–PGE2, N=505 from three clutches. Neutral-Red–mesalamine, N=695 from six clutches. Neutral-Red–6-mercaptopurine, N=705 from three clutches. Cyto-ID–PGE2, N=196 from three clutches. Cyto-ID–mesalamine, N=189 from three clutches. Cyto-ID–6-mercaptopurine, N=213 from three clutches. Error bar, mean±s.e.m. |
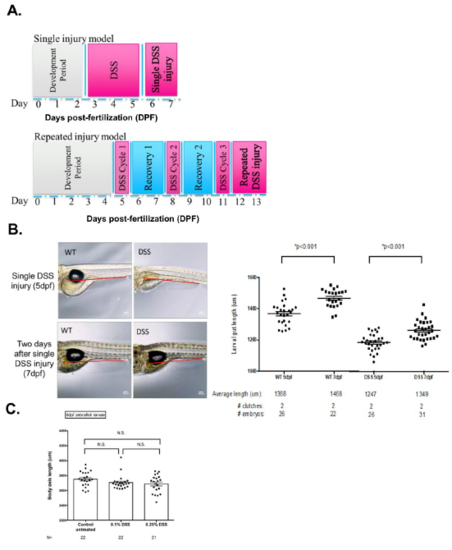
Gut length is shortened with DSS injury. (A) Timeline of single DSS and repeated DSS injuries. (B) Zebrafish images of untreated and single DSS injury (left panel). Red lines indicate the measurement of gut length. Quantification of gut length (right panel). Comparing to untreated controls, the gut length is significantly shortened after single DSS injury (P<0.001, N= 149 from 7 clutches). (C) The body axis length of untreated and 0.1% and 0.25% DSS treated larvae. |
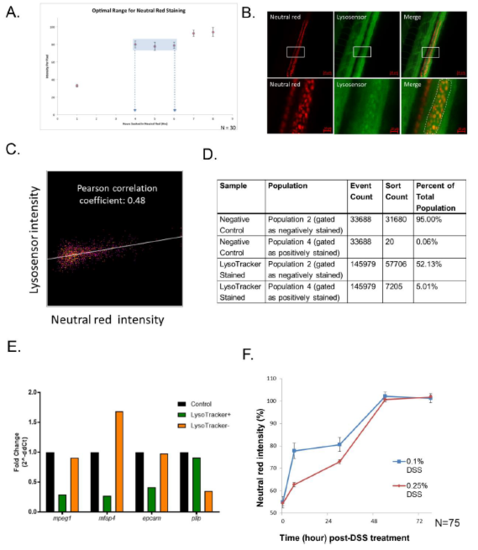
Optimization of neutral red staining. (A) Calibration curve of neutral red staining. Neutral red staining equilibrium is between 4-6 hours. N=30 (B) Images of Neutral red co-localizes with the lysosomal marker Lysosensor in zebrafish intestine (top panel). Total magnification 200X. Bar, 50μm. Zoom in quantification images (bottom panel) from selected area (white rectangle on top panel). Bar, 10μm. (C) Pearson correlation coefficient of Lyso-sensor and Neutral Red intensities in (B) bottom panel. (D-E) Lysosome-rich enterocyte (LRE) marker pllp enriched in Lysotracker-positive cells. 15 larvae intestines were dissected and cells were collected after single cell isolation with both Lysotracker staining and no staining control. The sorting result (D) showed 5.01% Lysotracker positive cells with minimum contamination (less than 0.06%). (E) qPCR results of marker for macrophages (mpeg1), mfap4, epithelia Disease Models & Mechanisms: doi:10.1242/dmm.037432: Supplementary information Disease Models & Mechanisms • Supplementary information (epcam) and LREs (pllp) in Lysotracker positive, negative relative to unsorted control cells. (F) The intestinal neutral red intensity recovers by 54 hours after removal from single DSS injury (N=75 from 3 clutches). |
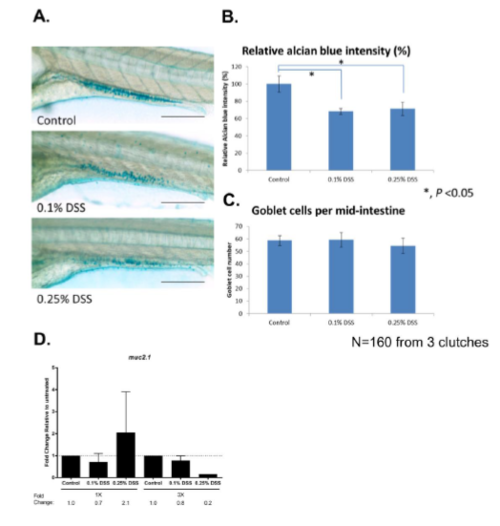
DSS reduces Alcian blue intensity after single DSS injury but does not affect goblet cell numbers. (A) Images of Alcian blue staining with 0.1% and 0.25% DSS treatment. The data was collected at the same time point as 0 hour in Figure 3e right panel. (B) Quantification of Alcian blue intensity relative to control. (C) Quantification of goblet cells per mid-intestine. N=160 from three clutches. (D) qPCR results of muc2.1 with single and repeated DSS injuries. |

Confocal tiled image with the full zebrafish larvae intestine. (a) The images of bright-field, lysosensor (green), pHrodo-E.coli (red) and merged images of red and green. pHrodo-labelled E. coli were ingested in LRE-enriched region of the intestine. Bar, 200 μm. (b) The images of bright-field, Cyto-ID (green), pHrodo-E.coli (red) and merged images of red and green. Cyto-ID staining is present and not limited to the region with ingested E. coli. Bar, 200 μm. |
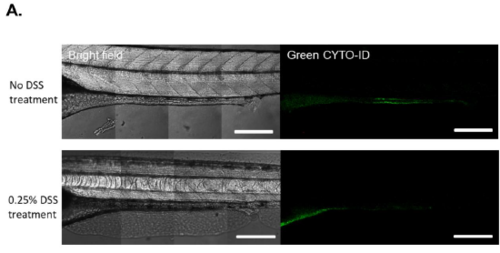
Confocal tiled image with the full zebrafish larvae intestine with and without DSS treatment. (a) The images of bright-field and Cyto-ID (green). Bar, 200 μm. |
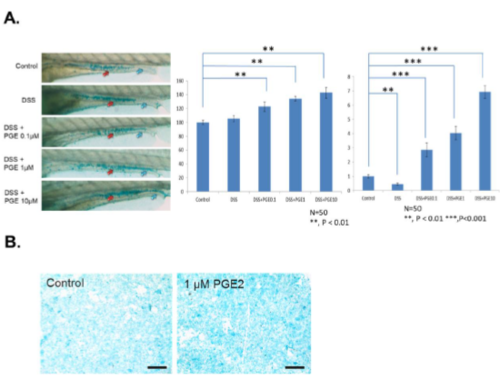
(A) The images of Alcian blue staining with DSS alone or with treatments with 0.1, 1 and 10 μM PGE2 (left panel). The quantification of the whole gut region (red arrows) is shown in the middle panel, and the blue arrows indicate quantification of lumen areas (right panel). Scale bar, 100 μm. (N=100 from 3 clutches). **, P < 0.01. ***, P < 0.001. (B) Images of human enteroid-differentiated epithelium monolayer with and without PGE2 treatment. Scale bar 100 μm. |