
Image
|
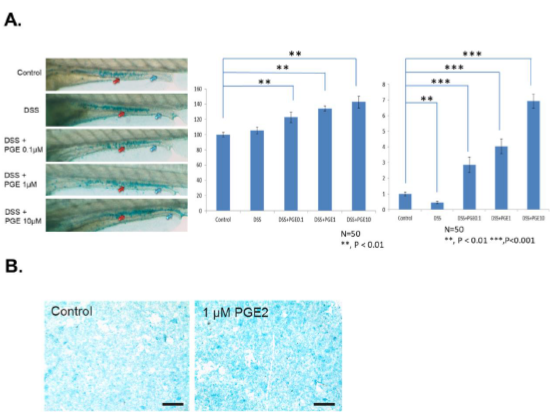
Figure Caption
Fig. S12
(A) The images of Alcian blue staining with DSS alone or with treatments with 0.1, 1 and 10 μM PGE2 (left panel). The quantification of the whole gut region (red arrows) is shown in the middle panel, and the blue arrows indicate quantification of lumen areas (right panel). Scale bar, 100 μm. (N=100 from 3 clutches). **, P < 0.01. ***, P < 0.001. (B) Images of human enteroid-differentiated epithelium monolayer with and without PGE2 treatment. Scale bar 100 μm.
Acknowledgments
This image is the copyrighted work of the attributed author or publisher, and
ZFIN has permission only to display this image to its users.
Additional permissions should be obtained from the applicable author or publisher of the image.
Full text @ Dis. Model. Mech.