
|
Fig. S2
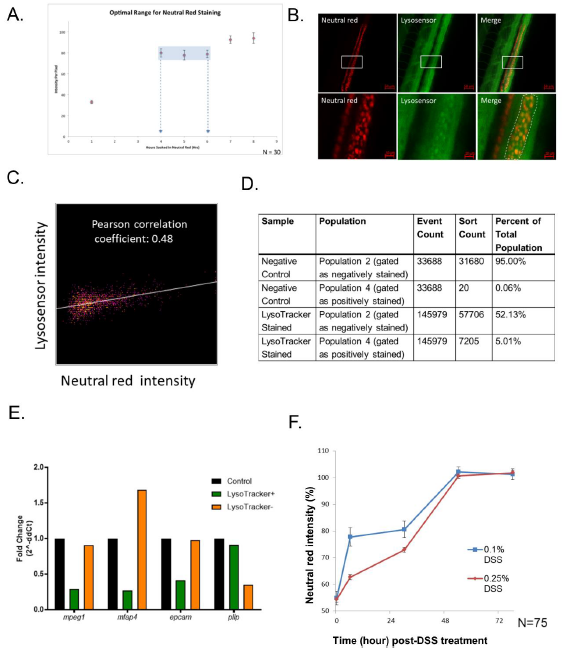
Optimization of neutral red staining. (A) Calibration curve of neutral red staining. Neutral red staining equilibrium is between 4-6 hours. N=30 (B) Images of Neutral red co-localizes with the lysosomal marker Lysosensor in zebrafish intestine (top panel). Total magnification 200X. Bar, 50μm. Zoom in quantification images (bottom panel) from selected area (white rectangle on top panel). Bar, 10μm. (C) Pearson correlation coefficient of Lyso-sensor and Neutral Red intensities in (B) bottom panel. (D-E) Lysosome-rich enterocyte (LRE) marker pllp enriched in Lysotracker-positive cells. 15 larvae intestines were dissected and cells were collected after single cell isolation with both Lysotracker staining and no staining control. The sorting result (D) showed 5.01% Lysotracker positive cells with minimum contamination (less than 0.06%). (E) qPCR results of marker for macrophages (mpeg1), mfap4, epithelia
Disease Models & Mechanisms: doi:10.1242/dmm.037432: Supplementary information
Disease Models & Mechanisms • Supplementary information
(epcam) and LREs (pllp) in Lysotracker positive, negative relative to unsorted control cells. (F) The intestinal neutral red intensity recovers by 54 hours after removal from single DSS injury (N=75 from 3 clutches).