
- Title
-
Vegfa/vegfr2 signaling is necessary for zebrafish islet vessel development, but is dispensable for beta-cell and alpha-cell formation
- Authors
- Toselli, C.M., Wilkinson, B.M., Paterson, J., Kieffer, T.J.
- Source
- Full text @ Sci. Rep.
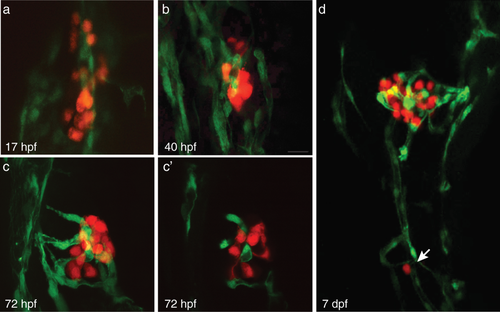
The endocrine pancreas develops adjacent to vessels and is highly vascularized. (a–c) Confocal projections of the pancreatic islet at 17 hpf, 40 hpf, and 72 hpf in Tg(fli1:EGFP; insa:tagRFP); endothelial cells (green) and beta-cells (red). (c’) Confocal section of projection in (c). (d) Confocal projection of 7 dpf Tg(fli1:EGFP; insa:tagRFP) pancreas. Arrow indicates secondary islet.
|

Inhibiting Vegf signaling does not affect beta-cell and alpha-cell formation. (a–c) Confocal projections of 72 hpf Tg(fli1:EGFP; insa:tagRFP) untreated, DMSO-treated, and SU5416-treated embryos from 12 to 72 hpf; endothelial cells (green), beta-cells (red), and DAPI nuclear stain (DNA; grey). Alpha-cells are labeled with a glucagon (GCG) antibody (blue). (d) The number of endothelial cells adjacent to beta-cells in untreated, DMSO-treated, and SU5416-treated embryos from 12 to 72 hpf. (e,f) The number of beta-cells and alpha-cells in Tg(fli1:EGFP; insa:tagRFP) untreated, DMSO-treated, and SU5416-treated embryos from 12 to 72 hpf. n = 14–20. (g) The number of beta-cells in Tg(fli1:EGFP; insa:tagRFP) untreated, DMSO-treated, and SU5416-treated embryos from 72 hpf to 92 hpf. n = 8–13. (h–j) Confocal projections of 96 hpf Tg(fli1:EGFP; insa:tagRFP) untreated, DMSO-treated, and SU5416-treated embryos from 72 to 96 hpf; endothelial cells (green), beta-cells (red), and DAPI (grey). (d–g) Box-and-whisker plots show median, and circles represent individual zebrafish. Scale bar = 10 μm.
|
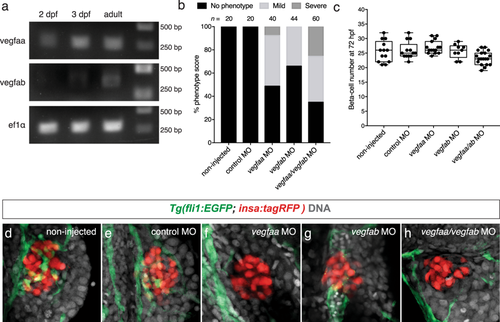
Vegfaa and Vegfab are necessary for islet vessel development. (a) RT-PCR of vegfaa and vegfab on sorted 2 dpf, 3 dpf, and adult beta-cells. Full length gel is presented in Supplementary Fig. 3. (b) Phenotypic score of islet vessels in non-injected, control morpholino and vegfaa, vegfab, or vegfaa/vegfab morpholino injected Tg(fli1:EGFP; insa:tagRFP) embryos. Phenotypes are scored such that no phenotype is comparable to wildtype (more than 7 endothelial cells adjacent to beta-cells), mild phenotype (4–7 endothelial cells adjacent to beta-cells), and severe phenotype (less than 4 endothelial cells adjacent to beta-cells). (c) The number of beta-cells in 72 hpf Tg(fli1:EGFP; insa:tagRFP) control and morpholino injected embryos. In the vegfaa, vegfab, and vegfaa/ab morpholino injected embryos, only the embryos that demonstrated a reduction or absence of islet vessels were counted. n = 9–21. Box-and-whisker plots show median, and circles represent individual zebrafish. (d–h) Confocal projections of (d) non-injected, (e) scrambled injected, (f) vegfaa, (g) vegfab, or (h) vegfaa/ab morpholino injected embryos at 72 hpf; endothelial cells (green), beta-cells (red), and DAPI (grey). Scale bar = 10 μm.
|

Knockdown of Vegfr2 receptors kdr and kdrl leads to disruptions in islet vessel development. (a) Phenotypic score of islet vessels in non-injected, control morpholino, and kdr, kdrl, or kdr/kdrl morpholino injected Tg(fli1:EGFP; insa:tagRFP)embryos. (b) The number of beta-cells in 72 hpf Tg(fli1:EGFP; insa:tagRFP) control and morpholino injected embryos. In the kdr/kdrl morpholino injected embryos, only the embryos that demonstrated a reduction or absence of islet vessels were counted. Box-and-whisker plots show median, and circles represent individual zebrafish. n = 17–24. (c–e) Relative expression of (c) insa, (d) pdx1, and (e) neuroD in isolated beta-cells of control injected and kdr/kdrl morpholino injected Tg(fli1:EGFP; insa:tagRFP) embryos at 72 hpf. All values were normalized to ef1α. *p < 0.0001 by Student’s t-test. (f–j) Confocal projections of (f) non-injected, (g) control injected, (h) kdr, (i) kdrl, or (j) kdr/kdrl morpholino injected embryos at 72 hpf; endothelial cells (green), beta-cells (red), and DAPI (grey). Scale bar = 10 μm.
|
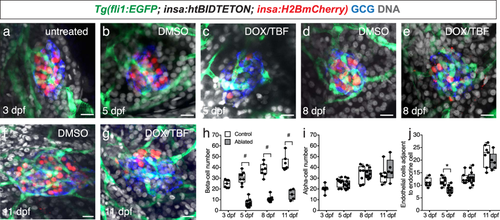
The number of islet endothelial cells decreases after beta-cell ablation. (a–g) Confocal projections of (a) 3 dpf, (b) 5 dpf control, (c) 5 dpf beta-cell ablated fish, (d) 8 dpf control, (e) 8 dpf beta-cell ablated fish, (f) 11 dpf control, (g) 11 dpf beta-cell ablated Tg(-1.2ins:htBidTE-ON; -1.2ins:H2BmCherry; fli1:EGFP) fish; endothelial cells (green), beta-cells (red), glucagon (blue) and DAPI (grey). Scale bar = 10 μm. (h–j) The number of (h) beta-cells, (i) alpha-cells, and (j) endothelial cells during beta-cell ablation and regeneration in Tg(-1.2ins:htBidTE-ON; -1.2ins:H2BmCherry; fli1:EGFP) fish treated with either DMSO (control) or DOX/TBF (beta-cell ablated) from 3–5 dpf. Box-and-whisker plots show median, and circles represent individual zebrafish. n = 5–12. Student’s t-test was conducted between the control and ablated groups at the same timepoint. #p < 0.0001, *p = 0.0004.
|