
- Title
-
Spexin Suppress Food Intake in Zebrafish: Evidence from Gene Knockout Study
- Authors
- Zheng, B., Li, S., Liu, Y., Li, Y., Chen, H., Tang, H., Liu, X., Lin, H., Zhang, Y., Cheng, C.H.K.
- Source
- Full text @ Sci. Rep.
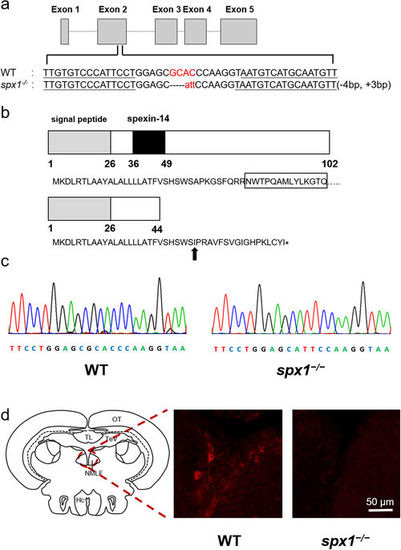
Targeted disruption of zebrafish SPX1 gene. (a) The location of the TALEN binding sites on the zebrafish SPX gene and the mutated genotype analyzed in this study. The TALEN binding sites are underlined. The inserted nucleotides are shown in lower case letters. (b) Nucleotide and amino acid sequence data for wild type and spx1 −/− genotype. Letters in box indicates the mature 14 amino acid SPX1 peptide. The new stop codon of the mutant is indicated by asterisk. Black arrow indicates the mutation starting position. (c) Comparison of two genotype sequences. (d) Detection of SPX1 expression in the brain of WT and spx1 −/− mutant fish. Note that the expression of SPX1 (red) is present in the nucleus of medial longitudinal fasciculus (NMLF) in WT while no signal can be observed in the mutant one. Hc, caudal zone of the periventricular hypothalamus, NMLF, nucleus of the medial longitudinal fascicle; OT, optic tectum; TeV, tectal ventricle; TL, torus longitudinalis. |
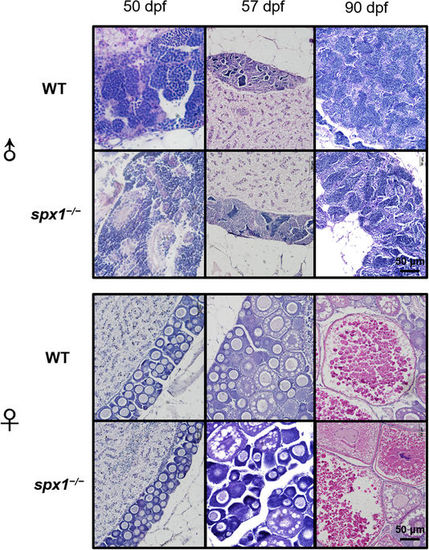
Gonad histology of the zebrafish spx1 −/− mutant lines during puberty. Male and female zebrafish were sampled at 50, 57 and 90 dpf. PHENOTYPE:
|
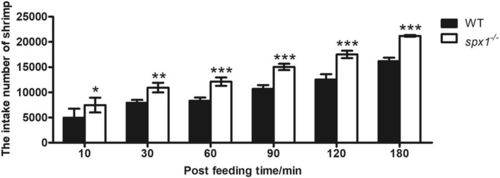
Quantitative analysis of zebrafish food intake using brine shrimp as prey. Data were obtained in triplicate and are represented as mean ± s.e.m. (n = 3). *P < 0.05; **P < 0.01; ***P < 0.001 by two-way ANOVA with Bonferroni’s post hoc test (versus corresponding WT group at each time point). PHENOTYPE:
|
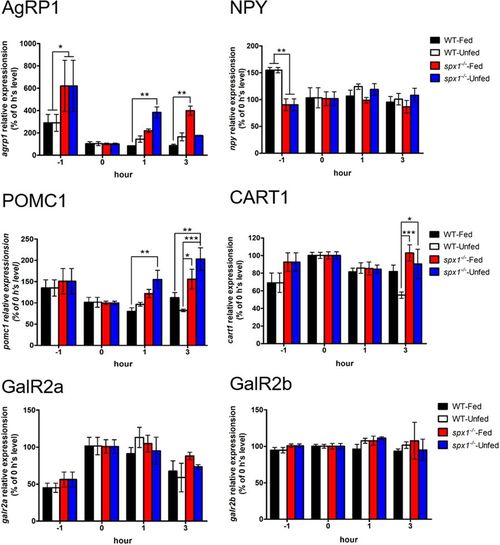
Gene expression analysis of neuropeptides and receptors in the hypothalamus in response to feeding. Quantitative PCR analysis is used to measure mRNA levels of AgRP1 and NPY (upper panel), POMC1 and CART1 (middle panel), GalR2a and GalR2b (lower panel) in WT and spx1 −/− zebrafish at 1 h, 0 h before feeding, 1 h and 3 h after feeding. Expression of elongation factor 1 alpha is used to normalize all samples. All relative expressions are represented as the ratio to the 0 h level respectively. Data were obtained in triplicate and are represented as mean ± s.e.m. (n = 3). *P < 0.05; **P < 0.01; ***P < 0.001 by two-way ANOVA with Bonferroni’s post hoc test. |
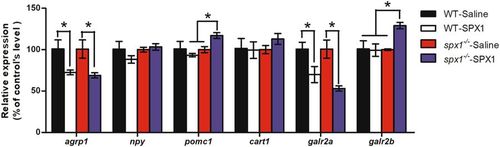
Gene expression analysis of neuropeptides and receptors in the hypothalamus in response to SPX1 intracranial administration. Quantitative PCR analysis is used to measure mRNA levels of WT and spx1 −/− zebrafish. Expression of elongation factor 1 alpha is used to normalize all samples. All relative expressions are represented as the ratio to the saline control. Values are means ± s.e.m. (n = 3). *P < 0.05 by one-way ANOVA with Bonferroni’s post hoc test. |
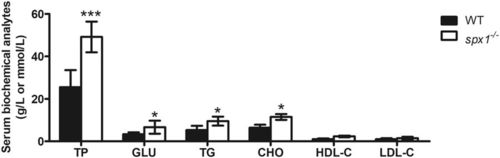
Serum biochemical analytes level in WT and spx1 −/− zebrafish. For each sample, serum from 10 to 20 fishes was mixed as a pool. Data are represented as means ± s.d. (n = 5). *P < 0.05; ***P < 0.001 by Student’s t test (versus corresponding WT group at each time point). TP, total protein (g/L); GLU, glucose (mmol/L); TG, triacylglycerol (mmol/L); CHO, cholesterol (mmol/L); HDL-C, high density lipoprotein cholesterol (mmol/L); LDL-C, low density lipoprotein cholesterol (mmol/L). |

The standard length, body weight and the condition factor of WT and spx1 −/− zebrafish on different day post fertilization. Two-way ANOVA was performed and difference was not significant. Data are represented as means ± s.d. (n = 8). PHENOTYPE:
|
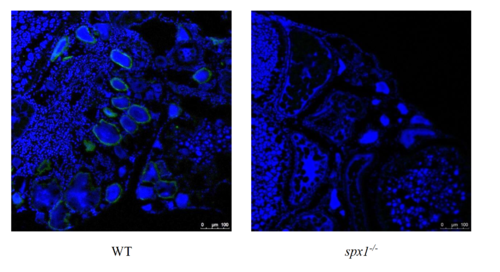
Detection of SPX1 expression in zebrafish ovaries of wild type and spx1-/- mutant. Note that the expression of SPX1 (green) is present in the wild type ovary while no signal can be observed in the mutant one. Nucleus is stained by DAPI (blue). |