
Image
|
Figure Caption
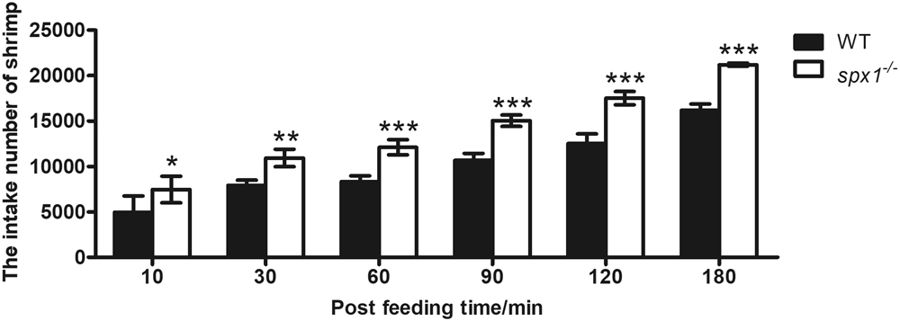
Fig. 3 Quantitative analysis of zebrafish food intake using brine shrimp as prey. Data were obtained in triplicate and are represented as mean ± s.e.m. (n = 3). *P < 0.05; **P < 0.01; ***P < 0.001 by two-way ANOVA with Bonferroni’s post hoc test (versus corresponding WT group at each time point).
Figure Data
Acknowledgments
This image is the copyrighted work of the attributed author or publisher, and
ZFIN has permission only to display this image to its users.
Additional permissions should be obtained from the applicable author or publisher of the image.
Full text @ Sci. Rep.