
- Title
-
Analysis of two transcript isoforms of vacuolar ATPase subunit H in mouse and zebrafish
- Authors
- Zhao, W., Zhang, Y., Yang, S., Hao, Y., Wang, Z., Duan, X.
- Source
- Full text @ Gene
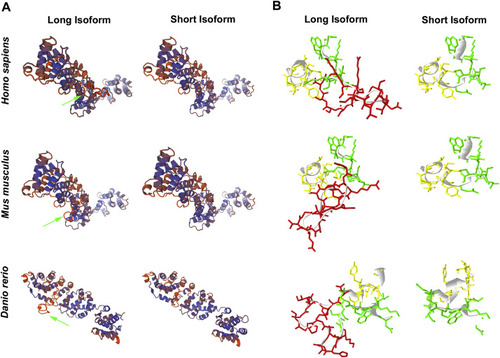
Comparison of three-dimensional structure using SWISS-MODEL analysis. A. 3D view of ATP6V1H protein. SWISS-MODEL 1ho8 and 3j9t are used to analysis ATP6V1H protein of Homo sapiens, Mus musculus and Danio rerio, respectively. The protein shows a large N terminal head and a small C terminal tail. Both N terminal and C terminal domain consist of some consecutive helices, and their connection presents as a shallow groove. The inserting eighteen amino acids in long isoform (green arrow) locate close to the central position of groove. Without the eighteen amino acids, the short isoform shows a shallower space between N part and C part, and the protein becomes looser. B. Local view of the inserting eighteen amino acids using Deepview. The eighteen amino acids are labeled in red and the ten amino acids before and after this domain are labeled in green and yellow, respectively. (For interpretation of the references to colour in this figure legend, the reader is referred to the web version of this article.) |
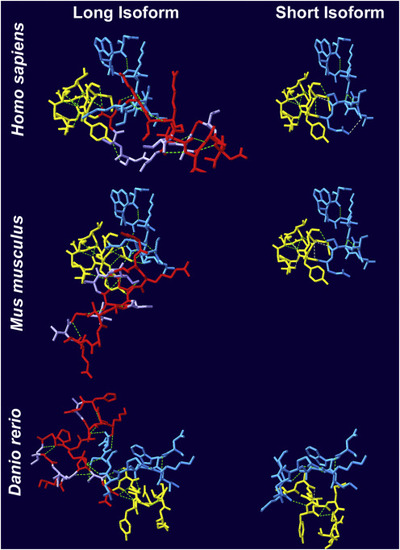
H-bonds and phosphorylation sites between two isoforms. The number and location of H-Bond are compared using Swiss-PdbViewer. The eighteen amino acids in long isoform are shown in red, and the ten amino acids before and after this region are labeled in blue and yellow, respectively. The H-bonds (≤ 3.3) are displayed in green dash line, and the H-Bonds (> 3.3) are labeled in gray dash line. There are six to eight H-bonds among the eighteen amino acids region in different species. Among the inserting eighteen amino acids, the phosphorylation sites are displayed in light cyan. There are six phosphorylation sites in this region of human and mouse protein and five phosphorylation sites in that of zebrafish. (For interpretation of the references to colour in this figure legend, the reader is referred to the web version of this article.) |

mRNA and protein analysis of two isoforms in mouse. A. Schematic map of primers in the RT-PCR and Q-PCR analysis. B. RT-PCR images of two transcripts among different tissues. C and D. Q-PCR analysis results of two transcripts in one representative experiment. Most tissues had more of long transcript than the short one. But the brain had a reverse ratio, and the testis and heart almost had the equal amounts of two transcripts. Osteoclasts were the cells that only expressed long transcript among the tissues or cells we detected. Error bars labeled the highest and lowest RQ value. E. Western blot analysis showed the different ratios of two isoforms in brain and kidney. F. Immunohistochemical staining showed the ATP6V1H locations in kidney and brain. |
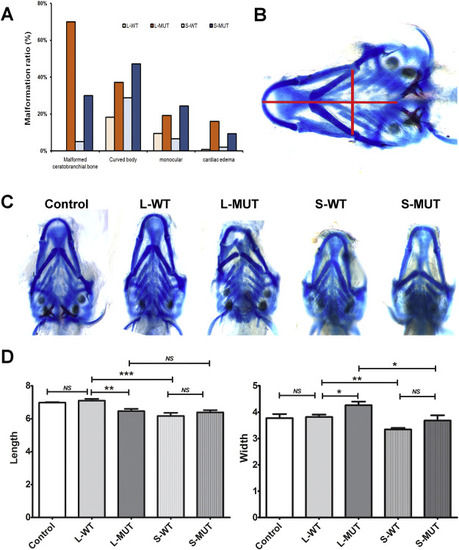
In vivo analysis of two isoforms of zebrafish atp6v1h. A. The long and short zebrafish atp6v1h mRNA were injected into zebrafish embryos. After 7 days of injection, the ratios of malformed ceratobranchial bone, curved body, monocular and cardiac edema were compared among long mRNA (L-WT, L-MUT) and short mRNA (S-WT, S-MUT). The mutant group showed a higher malformation percent that the wild type in one representative experiment. And the short isoform showed an obvious lower ratio of malformed ceratobranchial bone than the longer one. B ~ D. Comparison of zebrafish heads. The embryos were collected and stained with alcian blue/alizarin red after 7 days of injection. Both long and short variants with c.G1092T_A1093T (NM_001291708) caused malformation changes in craniofacial bone. The short atp6v1h mRNA reduced the length and width of the zebrafish. B. Red lines represent the length (from the front of Meckel's cartilage to the connections of two 5th ceratobranchial structures) and width (distance between the outermost vertex of the left and right ceratohyal) for the calculations. C. Represent images in each group. D. Comparison tables. n ≥ 20.WT: wild type, L: long variant, S: short variant. MUT: Double mutants G1092T_A1093T. NS: not significant. *: P < 0.05; **: P < 0.01; ***:P < 0.001. (For interpretation of the references to colour in this figure legend, the reader is referred to the web version of this article.) |
Reprinted from Gene, 638, Zhao, W., Zhang, Y., Yang, S., Hao, Y., Wang, Z., Duan, X., Analysis of two transcript isoforms of vacuolar ATPase subunit H in mouse and zebrafish, 66-75, Copyright (2018) with permission from Elsevier. Full text @ Gene