
- Title
-
Nuclear movement regulated by non-Smad Nodal signaling via JNK is associated with Smad signaling during zebrafish endoderm specification
- Authors
- Hozumi, S., Aoki, S., Kikuchi, Y.
- Source
- Full text @ Development
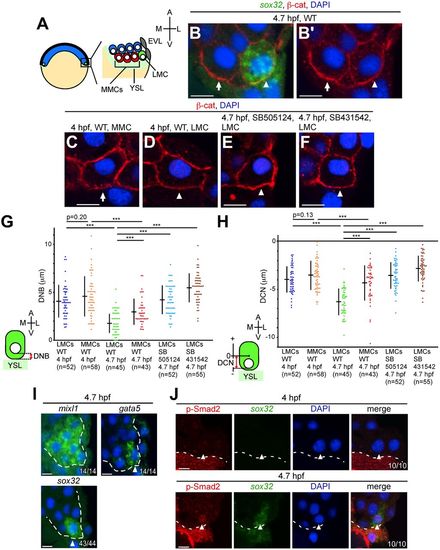
Nuclear movement toward the YSL in LMCs occurs at 4.7 hpf. (A) Illustration of the zebrafish blastula embryo (left) and location of marginal cells (right). LMCs refers to the most laterally located marginal cells (green); MMCs, medial marginal cells (red); EVL, enveloping layer; YSL, yolk syncytial layer; A, animal; V, vegetal; M, medial; L, lateral. (B-F) Transverse sections of wild-type (WT) and TGFβ type I receptor inhibitor (SB505124 or SB431542)-treated embryos. The cell membrane and the nucleus are visualized by β-catenin (β-cat) and DAPI staining, respectively. The endoderm marker sox32 was detected by FISH (B only). Arrows and arrowheads indicate MMCs and LMCs, respectively. (G) Minimum distance between the most vegetal position of the nucleus and the blastoderm/YSL boundary (DNB) in WT and TGFβ receptor inhibitor-treated embryos. (H) Minimum distance between the center of the cell and the most vegetal position of the nucleus (DCN) relative to the animal-vegetal axis in WT and TGFβ receptor inhibitor-treated embryos. In the DCN, the center of the cell is defined as zero; the animal and vegetal sides relative to the center of cell are set as plus and minus along the animal and vegetal axes, respectively. (G,H) ***P<0.001. n, number of nuclei examined. (I) Transverse sections of WT embryos showing mixl1, gata5 and sox32 FISH (green) at 4.7 hpf. DAPI, blue. The number of embryos showing this pattern among the total examined is indicated bottom right. Arrowheads indicate LMCs. Dashed lines indicate the boundary between the blastoderm and the YSL or EVL. (J) Transverse sections of WT embryos; p-Smad2 and sox32 were visualized via immunohistochemical staining and FISH, respectively. Arrowheads indicate the nucleus in LMCs. Dashed lines indicate the boundary between the blastoderm and the YSL. Scale bars: 10 µm. |
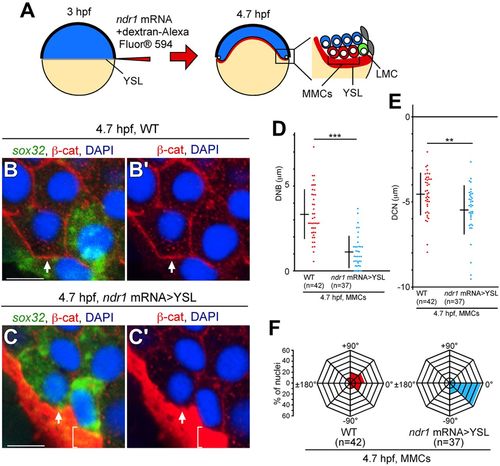
Overexpression of ndr1 mRNA in the YSL leads to nuclear movement in MMCs toward the YSL. (A) Experimental design for ndr1 mRNA overexpression in YSL (ndr1 mRNA>YSL). (B-C′) Transverse sections of WT and ndr1 mRNA>YSL embryos; the cell membrane, nucleus and sox32 mRNA were visualized by β-cat staining, DAPI staining and FISH, respectively at 4.7 hpf. Arrows indicate MMCs. Brackets indicate the fluorescence of dextran-Alexa Fluor 594 in the YSL. Both nuclear movement and sox32 expression in MMCs were induced by ndr1 mRNA>YSL at 4.7 hpf. Scale bars: 10 µm. (D,E) DNB and DCN in MMCs were measured in WT and ndr1 mRNA>YSL embryos. ***P<0.001, **P<0.05. (F) Angles between the center of the cell and the nucleus relative to the medial-lateral axis were measured in WT and ndr1 mRNA>YSL embryos as shown in Fig. S1. n, number of nuclei examined (D-F). |

C-syne2a overexpression prevents nuclear movement and p-Smad2 nuclear translocation in LMCs, possibly through regulation of MTOC positioning and MT formation. (A,B) Nuclear positioning in LMCs in WT and C-syne2a-overexpressing embryos at 4.7 hpf. Transverse sections of WT and C-syne2a-overexpressing embryos; cell membrane and nucleus were visualized by β-cat and DAPI staining, respectively. Arrowheads indicate LMCs. (C,D) DNB and DCN in LMCs were measured in WT and C-syne2a-overexpressing embryos at 4.7 hpf. n, number of nuclei examined. ***P<0.001. (E) Angles between the center of the cell and the nucleus in LMCs relative to the medial-lateral axis were measured as shown in Fig. S1. n, number of nuclei examined. (F) Transverse sections of WT embryos; p-Smad2 and sox32 were visualized by immunohistochemical staining and FISH, respectively. The number of nuclei examined is shown bottom right. Arrowheads indicate nuclei in LMCs. Dashed lines indicate the boundary between the blastoderm and the YSL. (G,H) Transverse sections of WT and C-syne2a-overexpressing embryos; cell membrane and MTOCs were visualized by β-cat and γ-tubulin (γ-tub) staining, respectively at 4.7 hpf. The star (H) indicates an MTOC that has detached from the nucleus in C-syne2a-overexpressing embryos. (I) Percentage of embryos with attached or detached MTOCs in WT or C-syne2a-overexpressing embryos at 4.7 hpf. n, number of nuclei examined. (J-L) Transverse sections of WT, C-syne2a-overexpressing and nocodazole-treated embryos; cell membrane, MTs and nuclei were visualized by β-cat, α-tub and DAPI staining, respectively at 4.7 hpf. The number of embryos examined is shown bottom right. An asterisk (K) indicates the EVL cell. (M) Percentage of cytoplasmic area occupied by MTs in LMCs of WT, C-syne2a-overexpressing and nocodazole-treated embryos. n, number of embryos examined. Error bars indicate s.d. of 20, 23 or 21 measurements. ***P<0.001. Scale bars: 10 µm. |

MTOC reorientation in LMCs is regulated by Nodal/JNK signaling. (A) Illustration of MTOC positioning (black dots) in LMCs. a, the minimum distance between the most vegetal position of MTOCs and the blastoderm/YSL boundary; b, length of the LMC. (B-G) Transverse sections of WT and of embryos treated with SB505124, SB431542, SP600125 or EMD 420123. MTOCs, cell membrane and nuclei are visualized by γ-tub, β-cat and DAPI staining, respectively at 4.0 and/or 4.7 hpf. Scale bars: 10 µm. (H) a/b ratio in WT and inhibitor-treated embryos at 4.0 or 4.7 hpf. n, number of nuclei examined. ***P<0.001. |

Inhibition of JNK signaling suppresses nuclear movement and p-Smad2 nuclear translocation in LMCs. (A-C) Transverse sections of WT, SP600125-treated and EMD 420123-treated embryos; cell membrane and nuclei were visualized by β-cat and DAPI staining, respectively at 4.7 hpf. (D,E) DNB and DCN in LMCs were measured in WT and inhibitor-treated embryos. ***P<0.001. (F) Transverse sections of WT and SP600125-treated embryos; p-Smad2 and sox32 were visualized by immunohistochemical staining and FISH, respectively. The number of embryos examined is shown bottom right. Arrowheads indicate nuclei in LMCs. Dashed lines indicate the boundary between the blastoderm and the YSL. Scale bars: 10 µm. |

JNK is activated by Nodal from the YSL. (A) Transverse sections of DMSO-treated control and SB505124-treated embryos; p-JNK and F-actin were visualized by immunohistochemical staining and phalloidin, respectively at 4.7 hpf. Fluorescent signals are displayed as grayscale images. Arrowheads indicate p-JNK fluorescence on the boundary between the YSL and LMCs. Asterisk indicates the cell membrane of EVL cells. Scale bars: 10 µm. (B) Fluorescence intensities were measured along the cell membrane on the boundaries between the YSL and LMCs (V), on cells located animal-pole side and LMCs (A), EVL and LMCs (L), or MMCs and LMCs (M). Error bars represent s.d. of ten measurements. n, number of nuclei examined. ***P<0.001. |
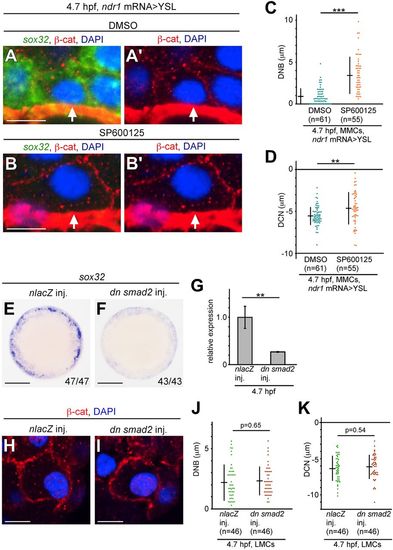
Nuclear movement is regulated by non-Smad JNK signaling independent of Smad signaling. (A-B′) Transverse sections of ndr1 mRNA>YSL embryos treated with DMSO as control (A,A′) and SP600125 (B,B′); the cell membrane, nucleus and sox32 mRNA were visualized by β-cat staining, DAPI staining and FISH, respectively at 4.7 hpf. Arrows indicate nuclei in MMCs. (C,D) Mean DNB and DCN values in MMCs of ndr1 mRNA>YSL embryos treated with SP600125 or DMSO at 4.7 hpf. n, number of nuclei examined. ***P<0.001, **P<0.05. (E,F) WISH of sox32 expression in nlacZ or dn smad2 mRNA-overexpressing embryos at 5.3 hpf. The number of embryos is shown bottom right. Animal pole views. (G) sox32 expression in nlacZ or dn smad2 mRNA-overexpressing embryos at 5.3 hpf measured by qPCR. Expression level of nlacZ-overexpressing embryos is set as 1.0. **P<0.05. Error bars represent s.d. of three independent experiments. (H,I) Transverse sections of nlacZ- and dn smad2-overexpressing embryos; the cell membrane and nuclei were visualized by β-cat and DAPI staining, respectively at 4.7 hpf. (J,K) DNB and DNC in LMCs were measured in nlacZ- and dn smad2-overexpressing embryos at 4.7 hpf. n, number of nuclei examined. Scale bars: 10 µm in A-B′,H,I; 200 µm in E,F. |

Visualization of Smad2 during nuclear movement. (A) Time-lapse confocal live imaging of EGFP-Smad2 in MMCs of nlacZ mRNA>YSL or ndr1 mRNA>YSL embryos. Scale bars: 10 µm. (B,C) DNB values (B) and nuclear/cytoplasmic ratio of EGFP-Smad2 fluorescence (C) of four or five independent nuclei (colored lines) in MMCs of nlacZ mRNA>YSL or ndr1 mRNA>YSL embryos. |