
- Title
-
Loss of the homologous recombination gene rad51 leads to Fanconi anemia-like symptoms in zebrafish.
- Authors
- Botthof, J.G., Bielczyk-Maczyńska, E., Ferreira, L., Cvejic, A.
- Source
- Full text @ Proc. Natl. Acad. Sci. USA

The rad51sa23805 allele leads to loss of Rad51 protein and causes DNA damage sensitivity. (A) Western blot showing the expression of Rad51 in testes extracts of WT and mutant zebrafish. β-Actin was used as a loading control. (B) Representative Rad51 immunostained embryos derived from a rad51+/− in-cross. Secondary only (i), Abcam primary (ii), AnaSpec primary (iii). (Magnification, 65×.) (C) Chromosome spreads of 24-hpf WT and mutant embryos treated with 1 µg/mL DEB for 20 h taken using a 100× oil-immersion objective. White arrows indicate characteristic damage (chromosome breaks and radial structures) in response to cross-linking agents (i). Quantification of the damage (ii). Mann–Whitney test, P = 0.0004, n+/+ = 25, n−/− = 26. (D) Comparison of the response of 48-hpf WT and mutant embryos to irradiation (i). (Magnification, 15×.) The black arrow indicates the small head and eye phenotype, which is quantified in ii. Two-tailed Fisher’s exact test pooling WT and heterozygotes as control group, P < 0.001, n = 67. (E) Immunostaining for pH2AX in WT and mutant embryos with pictures of representative embryos taken with a 63× water-immersion objective (i) and quantification of foci (ii). White arrows indicate example foci. Two-tailed Student’s t test, P < 0.0001, n+/+ = 8, n−/− = 11. |
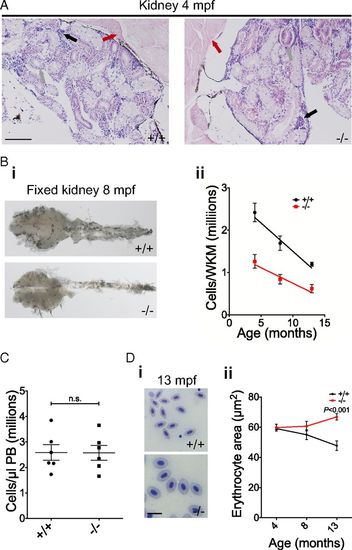
Adult rad51 mutant fish display kidney marrow cytopenia. (A) H&E-stained histological sections of 4-mpf WT and mutant kidneys using a 20× objective. Muscle (red arrow), ducts/tubules (gray arrow), and hematopoietic kidney marrow (black arrow) can be seen. (Scale bar, 100 µm.) (B) Fixed 8-mpf WT and mutant kidneys (i) (magnification, 10×); quantification of the number of total cells per freshly isolated kidney at different ages using a hemocytometer (ii). Two-way ANOVA was used and type III model fit [Armitage et al. (73)]. The test shows a significant influence of age [F(1, 50) = 18.23, P < 0.0001] and mutation status [F(1, 50) = 10.87, P = 0.0018] on phenotype. Four months postfertilization n+/+ = 6, n−/− = 6; 8 mpf n+/+ = 16, n−/− = 16; 13 mpf n+/+ = 6, n−/− = 4. (C) Quantification of PB cells in WT and mutant fish at 4 mpf. Two-sided t test, n+/+ = 6, n−/− = 6. n.s., not significant. (D) In i, blood smears of 13-mpf WT (Upper) and mutant fish (Lower) are compared. (Scale bar, 10 µm.) In ii, the change is quantified using two-way ANOVA and a type III model fit [Armitage et al. (73)]. There was a statistically significant interaction between age and mutation status [F(1, 28) = 12.89, P = 0.0012], no significant influence of age [F(1, 28) = 180.76, P = 0.392] and no significant influence of mutation status [F(1, 28) = 2.88, P = 0.1006]. P value shown on the graph stems from a post hoc Tukey multiple-comparison test. Four months postfertilization: n+/+ = 6, n−/− = 6; 8 mpf: n+/+ = 5, n−/− = 5; 13 mpf: n+/+ = 6, n−/− = 4. Bars represent mean ± SEM. PHENOTYPE:
|

ZFIN is incorporating published figure images and captions as part of an ongoing project. Figures from some publications have not yet been curated, or are not available for display because of copyright restrictions. |
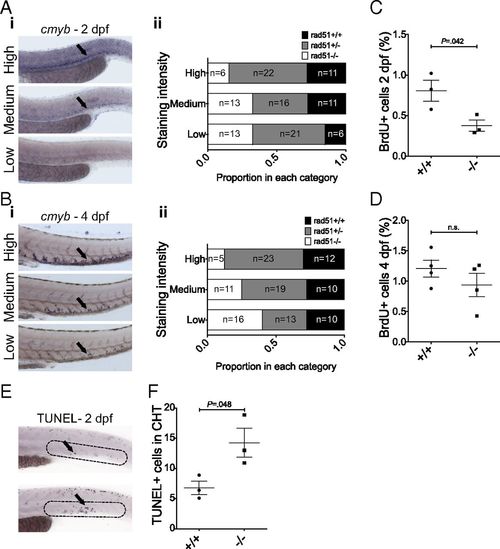
The rad51sa23805 HSPC defect starts during embryonic development. (A) ISH using a cmyb-specific probe at 2 dpf; the arrow shows HSPCs. Representative images of the three different staining categories are shown (i) and a quantification of the different genotypes (ii) n = 119 from two clutches. (B) ISH using a cmyb-specific probe at 4 dpf; the arrow shows HSPCs. Representative images of the three different staining categories are shown (i) and a quantification of the different genotypes (ii), n = 120 from two clutches. (C) Quantification of BrdU+ cells in the tail at 2 dpf. Two-sided Student’s t test, P = 0.042, n+/+ = 3, n−/− = 3. (D) Quantification of BrdU+ cells in the CHT at 4 dpf. Two-sided Student’s t test, n+/+ = 4, n−/− = 4. Bars represent mean ± SEM in C and D. n.s., not significant. (E) Representative images of TUNEL-stained 2 dpf embryos from a rad51+/− in-cross. Dotted lines indicate the area of the CHT that was scored. Arrows indicate TUNEL+ cells. (F) Quantification of three clutches of TUNEL-stained 2 dpf rad51+/− in-crosses. Each clutch was scored blindly and consisted of 10+/+ and 10−/− embryos each. Shown is the mean of all clutches ± SEM. (Magnification, 100× in all images.) |

The HSPC defects in rad51sa23805 fish are rescued in a p53 mutant background. (A) Representative images of 4-dpf embryos resulting from in-crosses of p53+/− rad51+/− parents stained using a cmyb-specific probe. The total number of embryos used (all genotypes) n = 237 from four clutches. For information about all genotypes, see SI Appendix, Table S3. Arrows indicate HSPCs. (Magnification, 100×.) (B) Percentage of BrdU+ cells in the kidney at 4 mpf at 1 dpi. Two-sided Student’s t test, np53+/+ rad51+/+ = 5, np53−/− rad51−/− = 5. (C) Number of total cells per kidney at 4 mpf quantified using a hemocytometer. Analysis using one-way ANOVA [F(3, 43) = 10.45, P < 0.0001], individual P values shown in the figure are from Tukey’s post hoc test, np53+/+ rad51+/+ = 16, np53+/+ rad51−/− = 16, np53−/− rad51+/+ = 6, np53−/− rad51−/− = 8. Bars represent mean ± SEM in B and C; n.s., not significant. |
|
ZFIN is incorporating published figure images and captions as part of an ongoing project. Figures from some publications have not yet been curated, or are not available for display because of copyright restrictions. PHENOTYPE:
|

Rad51 mutant fish are all infertile males. (A) H&E stained histological sections of 4 mpf wild type and mutant kidneys using a 20X objective. The arrow points out the area where mature spermatozoa reside. Scale bar=100 μm. (B) Capillaries used to obtain sperm from wild type and mutant fish. Numbers indicate the number of fish giving sperm among the fish tested. Two-tailed Fisher’s exact test, P=.0002. +/+, n=9. -/- n=13. PHENOTYPE:
|
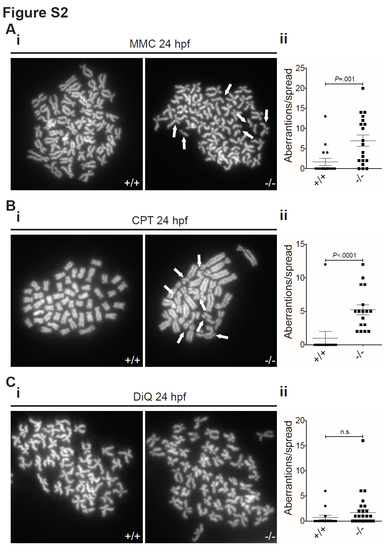
Loss of rad51 causes DNA damage sensitivity. (A) Chromosome spreads of 24 hpf wild type and mutant embryos treated with 5 μg/ml mitomycin C for 20 hours. White arrows indicate premature chromatid separation events (i). Quantification of the damage (ii). Mann- Whitney test, P=.001, n+/+=16, n-/-=19. (B) Chromosome spreads of 24 hpf wild type and mutant embryos treated with 1 nM CPT for 20 hours. White arrows indicate breaks and radial structures in response to topoisomerase inhibition (i). Quantification of the damage (ii). Mann-Whitney test, P<.0001, n+/+=12, n-/-=17. (C) Chromosome spreads of 24 hpf wild type and mutant embryos treated with 10μ μM DiQ for 20 hours (i). Quantification of the damage (ii). Mann-Whitney test, P=.13, n+/+=14, n-/-=29. Bars represent mean +/- SEM in all graphs. |

NHEJ inhibition does not lead to synthetic lethality in rad51 mutants. Morphology of 24 hpf embryos treated with varying concentrations of SCR-7 for 20 hours. |

Rad51 mutant fish are smaller than their wild type siblings. (A) Representative images of mutant and wt fish at 23 dpf (i). (ii) Graph showing difference in size between the genotypes. Two-sided Student’s t-test (P=.0016), n+/+=11, n-/-=7. Scale bar=1 mm. (B) Comparison of mutant and wild type fish at 4 mpf. Two-sided Student’s t-test (P=.004), n+/+=28, n-/-=19. Scale bar=1 cm. (C) (i) Representative images of mutant and wt fish at 8 mpf. (ii) Graph showing difference in size between the genotypes. Two-sided Student’s t-test (P=.023), n+/+=29, n-/-=31. Scale bar=1 cm. Bars represent mean +/- SEM in all graphs. PHENOTYPE:
|
|
ZFIN is incorporating published figure images and captions as part of an ongoing project. Figures from some publications have not yet been curated, or are not available for display because of copyright restrictions. PHENOTYPE:
|

P53 co-mutation increases the incidence of tumor development in double mutant fish, but does not rescue their fertility or size. (A) Male and female p53-/- rad51-/- fish at 4 mpf. (B) H&E stained histological sections of 4 mpf p53-/- and p53-/- rad51-/- ovaries using a 10X objective. Oocytes of different maturation stages are apparent in both genotypes. Scale bar=100μm. (C) H&E stained histological sections of 4 mpf p53-/- and p53-/- rad51-/- testes using a 20X objective. Arrows indicate normal location of mature spermatozoa Scale bar=100μm. (D) Quantification of the size of wild type and p53-/- rad51-/- fish at 4 mpf. Twotailed Student’s t-test, P=.008, np53+/+ rad51+/+=27, np53-/- rad51-/-=9. (E) 5-month-old p53-/- rad51-/- fish with tumor behind the eye (top). Accompanying H&E stained histological sections of the tumor (bottom) using 2.5 and 63X objectives. Scale bar=500 μm and 10 μm respectively. (F) (i) and (ii) Tumors observed in 8 mpf female p53-/- rad51-/- fish in the body cavity around the ovarian tissue. Scale bar=500 μm and 10 μm respectively. Overall, 3/9 aged double mutants showed tumors. PHENOTYPE:
|