
- Title
-
Identification and Expression Analysis of the Complete Family of Zebrafish pkd Genes.
- Authors
- England, S.J., Campbell, P.C., Banerjee, S., Swanson, A.J., Lewis, K.E.
- Source
- Full text @ Front Cell Dev Biol
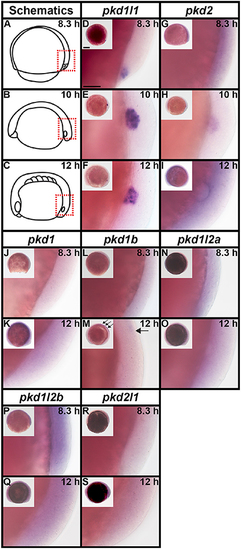
pkd2 and pkd1l1 are expressed in Kupffer's vesicle. Lateral expression of pkd genes at 8.3, 10, and 12 h. Region shown in main panel at each stage is indicated by red dotted boxes in schematics (A–C). Inset images in (D–S) show whole-mount view of embryo, dorsal forerunner cells/KV located in bottom right-hand corner. There is no expression of pkd1, pkd1b, pkd1l2a, pkd1l2b, or pkd2l1 in dorsal forerunner cells or KV at any of these stages. The boundary of the KV cavity is faintly visible in M as a slightly different focal plane has been shown to include spinal cord expression. However, pkd1b is not expressed in the margin of KV. Arrows in (M) indicate caudal limit of spinal cord expression of pkd1b. pkd1l1 is expressed in the KV region at all three stages (D–F) and pkd2 is expressed at 10 and 12 h but not 8.3 h (G–I). Scale bar (D) = 50 μm, (D–S) main panels and 200 μm, inset panels. EXPRESSION / LABELING:
|

Expression of pkd genes in zebrafish embryos and larvae. Lateral views of whole embryo expression of pkd genes at 24 h and 5 dpf. Rostral left, dorsal up. (A,B) pkd1 is strongly expressed in the pronephros at 24 h (arrows, A) but not at 5 dpf. By 5 dpf, pkd1 expression persists only in the putative taste receptors (white asterisks, B). (C,D) pkd1b is broadly expressed throughout the dorsal-ventral hindbrain and spinal cord, and in the caudal-most midbrain at 24 h. By 5 dpf, strong expression persists in the floor plate in the midbrain and hindbrain, whilst weaker expression persists in putative taste receptors of the pharynx (white asterisks, D). (E,F) pkd1l1 is not expressed at 24 h but is detected in the ear at 5 dpf (white dotted line, F). (G,H) pkd1l2a is expressed in cells in the ventral-most spinal cord at 24 h. This expression persists at 5 dpf, as does expression in putative taste receptors (white asterisk, H). (I,J) pkd1l2b expression is not detected at 24 h and persists only weakly in the pharyngeal cartilage at 5 dpf (white asterisk, J). (K,L) pkd2 is expressed in the pronephros (arrows, K) and perhaps very weakly in the floor plate at 24 h (arrowheads, K). By 5 dpf, pkd2 expression is restricted to the ventral region of the rostral somites and putative taste receptors (white asterisks, L). (M,N) Like pkd1l2a, pkd2l1 is also expressed in cells in the ventral-most spinal cord at 24 h. This expression also persists at 5 dpf, together with weak expression in putative taste receptors (white asterisks, N). Low level diffuse staining in the brain in (A,C,F,H,L,N) and more widely in (E,I,K) is probably background staining. These embryos were stained for longer periods in order to try and detect any weak, but specific, expression in the spinal cord. As a consequence of this, the brain, which contains large ventricles which sometimes trap RNA riboprobes, often has background staining (see Section Discussion). Scale bar (A) = 100 μm. |

Spinal cord expression of zebrafish pkd genes. Lateral views showing expression of pkd genes at 1–5 dpf. Rostral left, dorsal up. (A–F) pkd1b is expressed broadly in the spinal cord. pkd1l2a (G–L) and pkd2l1 (M–R) are both expressed in two rows of cells in the ventral spinal cord and occasionally weakly in more dorsal cells (asterisk). (S–U) pkd1, (V–X) pkd1l1, (Y–A') pkd1l2b, and (B'–D') pkd2 are not expressed in spinal cord. Some of these embryos have background expression as we stained them for long periods of time to try and detect any weak, but specific, expression. Expression of pkd2 is visible in the rostral ventral somites (D'). Scale bar (A) = 50 μm. |
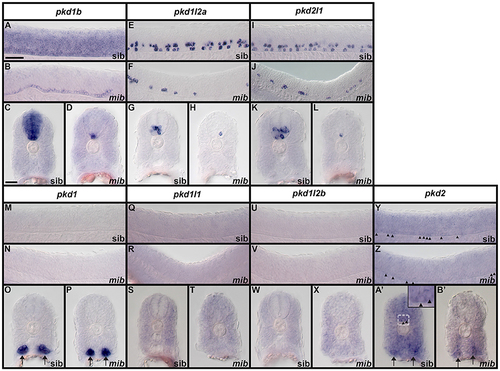
Expression of zebrafish pkd genes in mindbomb mutants. Lateral views (A,B,E,F,I,J,M,N,Q,R,U,V,Y,Z) and cross-sections (C,D,G,H,K,L,O,P,S,T,W,X,A',B') of pkd expression in the trunk of mindbomb mutants and sibling embryos with WT phenotypes. Dorsal is up. In lateral views, rostral is left and only the spinal cord region is shown. Arrows (O,P,A',B') indicate pronephros expression. Arrowheads (Y,Z,A' and higher magnification inset in A') indicate weak expression of pkd2 in the floor plate of the spinal cord. The focal plane in B' does not include labeled floor plate cells. Scale bar (A) = 50 μm (lateral views, A,B,E,F,I,J,M,N,Q,R,U,V,Y,Z); Scale Bar (C) = 30 μm (cross-sections, C,D,G,H,K,L,O,P,S,T,W,X,A',B') and 10 μm (inset in A'). EXPRESSION / LABELING:
|

Expression of pkd genes in kidney, somites and sensory organs. (A–D) Lateral view of pkd1 (A,B) or pkd2 (C,D) expression in pronephros (black and white arrows) at 27 and 36 h. Rostral left, dorsal up. pkd1 is strongly expressed in pronephros at 27 h (A). Expression starts to decline at 36 h (B). Expression of pkd2 is weak in pronephros at 27 h (C) and is reduced even further by 36 h (D). (E–H) Lateral expression of pkd genes in the ear at 4–5 dpf. Dotted line shows ear boundary. Weak expression of pkd1l1 (E) and pkd2l1 (G) is first detected at 4 dpf in the inner ear ectoderm that supports the posterior canal and posterior crista (black arrowheads). pkd1l1 is also weakly expressed in the utricular otolith (white arrows). By 5 dpf, pkd1l1 expression persists in the utricular otolith and the underlying utricular macula (white arrows). It is also expressed in neighboring ectoderm flanking the lateral canal and lateral crista (white asterisks; F). At 5 dpf the expression of pkd2l1 persists in tissue surrounding the posterior canal and posterior crista (black arrowheads; H). (I–M) Lateral view of pkd1 expression in neuromasts (white asterisks) and lateral line primordium (white dotted line) at 36 h and 3 dpf. Rostral left, dorsal up. Weak expression of pkd1 in neuromasts and lateral line primordium is first detected at 36 h [I, higher magnification of the neuromasts (J) and lateral line primordium (K)]. By 3 dpf expression persists in neuromasts (L and higher magnification view, M). pkd1 is also expressed in pectoral fin buds (black arrows) at 36 h [dorsal view, rostral top (N), and lateral view—rostral left, dorsal up (O)]. (P–R) Lateral expression of pkd2 in rostral somites at 4 and 5 dpf. Rostral left, dorsal up. pkd2 is first expressed in the ventral half of each rostral somite at 4 dpf (black arrows in P, higher magnification in Q) and persists at 5 dpf (black arrows in R). (S–W) Lateral expression of pkd genes in the eye at 4 dpf. Rostral left, dorsal up. pkd1b, pkd1l1, pkd1l2a, pkd1l2b, and pkd2l1 are expressed in the ganglion cell layer (adjacent to lens, single white cross) and amacrine cells (outer cell layer immediately adjacent to ganglion cell layer, double white cross) of the eye at 4 dpf. The expression of pkd1b (S) and pkd1l2b is weak (V) and the expression of pkd1l1 (T), pkd1l2a (U), and pkd2l1 (W) is stronger. Only the expression of pkd1l2b persists in these cell layers at 5 dpf (data not shown). Scale bar (A) = 23 μm (J,K,M); 42 μm (E–H,O); 50 μm (A–D,Q,R); 55 μm (N); 62.5 μm (S–W); and 100 μm (I,L,P). |
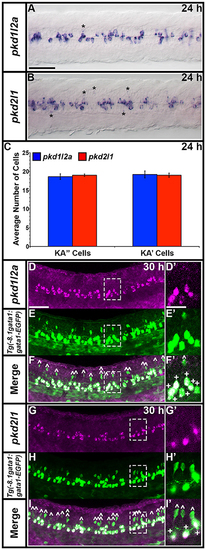
pkd1l2a and pkd2l1 are co-expressed in zebrafish KA cells. Dorsal view of pkd1l2a (A) and pkd2l1 (B) expression in 24 h spinal cord. Rostral left. Most of the labeled cells are KA cells that abut the central canal. Asterisks indicate expression in occasional weak, more lateral cells (that correspond to the more dorsal cells indicated in Figures 8G–R). Prolonged staining sometimes reveals additional weak, lateral cells (data not shown). (C) Average number of cells (y-axis) expressing pkd1l2a (blue) and pkd2l1 (red) in KA″ and KA′ cells (x-axis) at 24 h in WT spinal cord region adjacent to somites 6–10 (n = 5). Error bars indicate standard error of the mean. There is no statistical difference between the number of pkd1l2a and pkd2l1-expressing KA″ (p = 0.6419) and KA′ (p = 0.8571) cells respectively (Student's t-test). These data do not include occasional non-KA lateral cells (2 cells each in 2/5 pkd2l1-labeled embryos; 0 cells in 5 pkd1l2a-labeled embryos). (D–F',G–I') Lateral views of zebrafish spinal cord at 30 h. Anterior left, dorsal top. In situ hybridization (purple) for pkd1l2a (D,D') and pkd2l1 (G,G'), EGFP immunohistochemistry (green) in Tg(–8.1gata1:gata1-EGFP) embryos (E,E',H,H') and merged views (F,F',I,I'). (D'–I') Magnified single confocal plane of white dotted box region. 100% of pkd1l2a and pkd2l1-expressing KA cells co-express Tg(–8.1gata1:gata1-EGFP) and 100% of GFP-positive Tg(–8.1gata1:gata1-EGFP) KA cells co-express either pkd1l2a (F, indicated with + in F') or pkd2l1 (I, indicated with + in I'). No GFP-positive Tg(–8.1gata1:gata1-EGFP) dorsal V2b cells co-express either pkd1l2a (white ˆ in F,F') or pkd2l1 (white ˆ in I,I'). Double-labeled cells are not indicated in (D–I) main panels as they are so numerous. Scale bar (A) = 50 μm (A,B). Scale bar (D) = 50 μm (D–I) and 20 μm (D'–I'). |
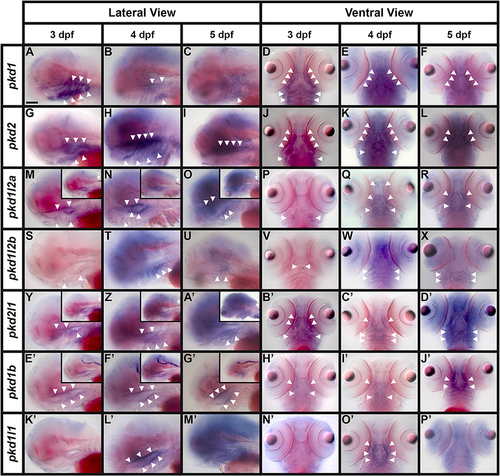
Expression of pkd genes in taste bud regions. Lateral (A–C,G–I,M–O,S–U,Y,Z,A',E'–G',K'–M') and ventral (D–F,J–L,P–R,V–X, B'–D',H'–J',N'–P') views of pkd gene expression at 3, 4, and 5 dpf. Rostral is left Rostral is left (A–C,G–I,M–O,S–U,Y,Z,A',E'–G',K'–M') and top (D–F,J–L,P–R,V–X,B'–D',H'–J',N'–P'). In most of the lateral views, the eyes are out of focus. Insets in (M–O) and (Y–A') show expression of pkd1l2a and pkd2l1 in KA cells in the rostral spinal cord (small white arrows). Insets in (E'–G') show expression of pkd1b in the floor plate of the midbrain and hindbrain. White arrowheads indicate the locations of pharyngeal expression. Scale bar (A) = 100 μm. EXPRESSION / LABELING:
|

Spinal cord expression of zebrafish pkd genes Lateral views of additional stages of pkd spinal cord expression not included in other figures. Rostral left, dorsal up. By 36 h, pkd1b is expressed in two ventral rows of cells in the spinal cord (A). This expression persists at 4 dpf (B). pkd1l2a and pkd2l1 are co-expressed in KA cells (C-F) and occasional weak more dorsal cells (asterisks D & E). pkd1, pkd1l1, pkd1l2b and pkd2 are not expressed in spinal cord (G-Z). Scale bar (A) = 50 μm. |