FIGURE SUMMARY
Title

PEG-b-PCL polymeric nano-micelle inhibits vascular angiogenesis by activating p53-dependent apoptosis in zebrafish.

Authors
Zhou, T., Dong, Q., Shen, Y., Wu, W., Wu, H., Luo, X., Liao, X., Wang, G.
Source
Full text @ Int. J. Nanomedicine

Figure 2 Embryo chorion absorption of PEG-b-PCL nano-micelles.
Notes: Embryos were exposed to 0, 60, 120, and 240 μg/mL FITC-labeled PEG-b-PCL nano-micelles. At 24 hpf, embryo chorions were manually removed. Bright-field and fluorescent images of embryos before and after chorion removal are shown.
Abbreviations: hpf, hours postfertilization; FITC, fluorescein isothiocyanate; PEG-b-PCL, poly(ethylene glycol)-b-poly(ε-caprolactone).

Figure 3 Effects of PEG-b-PCL on zebrafish embryos and larva.
Notes: (A) The mortality rates of embryos exposed to 0, 60, 120, and 240 μg/mL PEG-b-PCL nano-micelles. (B) Representative images showing the morphological changes of embryos exposed to different doses of nano-micelle at indicated stages. Red arrowheads indicate pericardial edema, black arrowheads indicate yolk sac deformation, and blue arrowheads indicate tail curve. (C) Quantification of 72 hpf embryos showing malformations, including pericardial edema, yolk sac deformation, and tail curve. Data are expressed as mean ± SEM from three independent experiments (n=180), *P<0.05, **P<0.01.
Abbreviations: hpf, hours postfertilization; PEG-b-PCL, poly(ethylene glycol)-b-poly(ε-caprolactone); SEM, standard error of mean.

Figure 4 PEG-b-PCL nano-micelle inhibits angiogenesis in zebrafish embryo.
Notes: (A) Fluorescent images of flk1-GFP positive vascular sprouting in 24 hpf unexposed embryos (Ctrl) and embryos exposed to 60, 120, and 240 μg/mL PEG-b-PCL nano-micelle. The top images are zoomed in the second top images, which are further zoomed in the bottom two images. White arrowheads indicate the absence of ISV and the dashed ovals indicate cavity in caudal vessels. (B) Quantification of ISV length in 24 hpf control embryos and embryos exposed to the indicated doses of PEG-b-PCL nano-micelles. (C) In situ hybridization analysis of flk1 expression in 24 hpf control embryos and embryos exposed to the indicated doses of PEG-b-PCL nano-micelles. The bottom images show the zoomed ISVs and caudal vessels. The black arrowheads indicate the absence of flk1 signal. (D) q-PCR analysis of flk1 mRNA expression in 24 hpf control and PEG-b-PCL treated embryos. Data are expressed as mean ± SEM from three biological samples. *P<0.05, **P<0.01.
Abbreviations: Ctrl, control; hpf, hours postfertilization; ISV, intersegmental vessel; PEG-b-PCL, poly(ethylene glycol)-b-poly(ε-caprolactone); qPCR, quantitative polymerase chain reaction; SEM, standard error of mean.

Figure 5 PEG-b-PCL nano-micelle induces apoptosis in zebrafish embryos.
Notes: (A) TUNEL analysis of apoptosis in control and PEG-b-PCL nano-micelle treated 24 hpf embryos. The bottom images showed the zoomed vessels. The white arrowheads indicate apoptotic cells. (B) Mean fluorescence intensity measurement of apoptosis shown in (A). (C, D) qPCR analysis of p53 and AIF mRNA expression in 24 hpf control and PEG-b-PCL exposed embryos. Data are expressed as mean ± SEM from three biological samples. *P<0.05, **P<0.01.
Abbreviations: Ctrl, control; hpf, hours postfertilization; PEG-b-PCL, poly(ethylene glycol)-b-poly(ε-caprolactone); qPCR, quantitative polymerase chain reaction; TUNEL, terminal deoxynucleotidyl transferase dUTP nick end labeling; SEM, standard error of mean; ns, not significant.

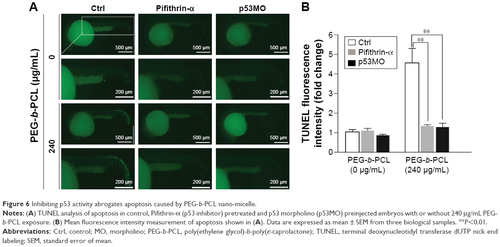
Figure 6 Inhibiting p53 activity abrogates apoptosis caused by PEG-b-PCL nano-micelle.
Notes: (A) TUNEL analysis of apoptosis in control, Pifithrin-α (p53 inhibitor) pretreated and p53 morpholino (p53MO) preinjected embryos with or without 240 μg/mL PEG-b-PCL exposure. (B) Mean fluorescence intensity measurement of apoptosis shown in (A). Data are expressed as mean ± SEM from three biological samples. **P<0.01.
Abbreviations: Ctrl, control; MO, morpholino; PEG-b-PCL, poly(ethylene glycol)-b-poly(ε-caprolactone); TUNEL, terminal deoxynucleotidyl transferase dUTP nick end labeling; SEM, standard error of mean.

Figure 7 p53 inhibition abrogates the angiogenic defects caused by PEG-b-PCL nano-micelle.
Notes: (A) Representative images of flk1-GFP-positive vascular sprouting in 24 hpf control, Pifithrin-α pretreated and p53MO preinjected embryos with or without 240 μg/mL PEG-b-PCL exposure. White arrowheads indicate the absence of ISV and the dashed oval indicates the cavity in caudal vessels. (B) Quantification of ISV length as shown in (A). (C) In situ hybridization analysis of flk1 expression in 24 hpf control, Pifithrin-α pretreated and p53MO preinjected embryos with or without 240 μg/mL PEG-b-PCL exposure. Black arrowheads indicate the absence of flk1 expression. (D) qPCR analysis of flk1 mRNA expression in 24 hpf control, Pifithrin-α pretreated and p53MO preinjected embryos with or without 240 μg/mL PEG-b-PCL exposure. Data are expressed as mean ± SEM from three biological samples. *P<0.05, ***P<0.001.
Abbreviations: Ctrl, control; hpf, hours postfertilization; ISV, intersegmental vessel; MO, morpholino; PEG-b-PCL, poly(ethylene glycol)-b-poly(ε-caprolactone); qPCR, quantitative polymerase chain reaction; SEM, standard error of mean.

Acknowledgments
This image is the copyrighted work of the attributed author or publisher, and ZFIN has permission only to display this image to its users. Additional permissions should be obtained from the applicable author or publisher of the image. Full text @ Int. J. Nanomedicine