
- Title
-
Tmem2 regulates cell-matrix interactions that are essential for muscle fiber attachment
- Authors
- Ryckebüsch, L., Hernandez, L., Wang, C., Phan, J., Yelon, D.
- Source
- Full text @ Development

Disrupted muscle fiber attachment in MZtmem2 mutants. (A-F) Lateral views display somite and notochord morphology at 24hours post-fertilization (hpf). Mtmem2 (A-C) control siblings are indistinguishable from wild-type. MZtmem2 mutants (D-F) exhibit a normal number of somites (32 somites in A,D) but have U-shaped (E) rather than chevron-shaped (B) somites and a slightly narrow notochord (bracket, F). (G-K) Immunofluorescence reveals muscle fiber organization, using Phalloidin (red) to recognize both fast and slow fibers and F59 (green) to recognize slow fibers; lateral views with dorsal up (except for transverse views in G′′′-I′′′) at 26hpf (G-I) or 5days post-fertilization (dpf) (J,K). MZtmem2 mutants display muscle fiber detachment (H-H′′), whereas Mtmem2 siblings exhibit normal fiber attachment (G-G′′). Attachment can be rescued in MZtmem2 mutants by injection of wild-type tmem2 mRNA (I-I′′; n=6/7). The severity of detachment in MZtmem2 mutants increases over time (K), indicating the importance of tmem2 for the maintenance of muscle fiber attachment. (L) Bar graph compares average prevalence of fiber attachment in somites at 48hpf; error bars indicate s.e.m. F59+ fibers were counted within 11 somites of multiple embryos [Mtmem2, n=6; MZtmem2, n=4; Mtmem2 expressing full-length tmem2 (‘+full’), n=6; MZtmem2+full, n=8; Mtmem2 expressing tmem2 ectodomain (‘+ecto’), n=2; MZtmem2+ecto, n=5]. Introduction of either full-length Tmem2 or the Tmem2 ectodomain into MZtmem2 mutants caused improvement in fiber attachment. Asterisks indicate significant differences from MZtmem2 (Student′s t-test; P<0.001 for full, P<0.05 for ecto). See also Table S1. |

Aberrant ECM organization at the MTJ in MZtmem2 mutants. (A-H) Immunofluorescence indicates localization of laminin (red, A′-D′) and fibronectin (red, E′-H′) relative to slow muscle fibers, labeled with F59 (green, A-H); lateral views, dorsal up, at 20 somite stage (so) (A,B,E,F) and 26hpf (C,D,G,H). (A-D) Laminin is present at the MZtmem2 MTJ by 20 so (B), although it appears disorganized compared with localization in Mtmem2 siblings (A). By 26hpf, laminin deposition appears diminished at the MZtmem2 MTJ (D). (E-H) Fibronectin fibrillogenesis is evident at the MZtmem2 MTJ at 20 so (F), albeit in an aberrant pattern that echoes the morphology of the MZtmem2 somites. By 26hpf, when much of the fibronectin has been degraded at the Mtmem2 MTJ (G), fibronectin levels appear increased in MZtmem2 mutants (H), particularly where fibers are detached. However, nearly all of this fibronectin degrades in MZtmem2 mutants by 40hpf (data not shown). EXPRESSION / LABELING:
PHENOTYPE:
|
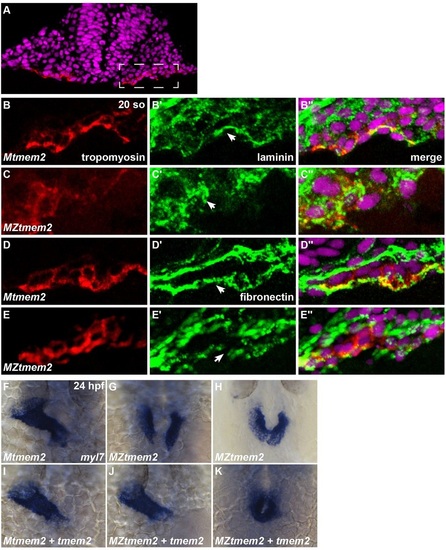
ECM disorganization accompanies cardia bifida in MZtmem2 mutants. (A-E) Immunofluorescence illustrates laminin (green; B′,C′) and fibronectin (green, D′,E′) localization near the myocardium (marked by tropomyosin in red); transverse sections, dorsal up, at 20 so, with DAPI (magenta). Dashed rectangle in A indicates the right cardiac primordium, closer views of which are shown in B-E. (B) During cardiac fusion, laminin deposition is normally evident on the basal side of the myocardium (arrowhead, B′) (Arrington and Yost, 2009). (C) In MZtmem2 mutants, laminin organization appears severely compromised (arrowhead, C′) and a discrete basal layer does not form. (D,E) Fibronectin fibrils normally underlie the myocardium during cardiac fusion (arrowhead, D′) (Trinh and Stainier, 2004), but fibronectin deposition appears irregular and disorganized in MZtmem2 mutants (arrowhead, E′). (F-K) Expression of myl7 at 24hpf in Mtmem2 (F,I) and MZtmem2 (G,H,J,K) siblings; dorsal views, rostral up. By 24hpf, the heart tube assembles normally in Mtmem2 siblings (F), but MZtmem2 mutants typically exhibit cardia bifida (G). Occasionally, MZtmem2 mutants display partial cardiac fusion (H, Table S2). Injection of tmem2 mRNA rescues cardiac fusion (K) in MZtmem2 mutants and can even restore heart tube formation (J, Table S2), but does not affect heart formation in Mtmem2 siblings (I, Table S2). EXPRESSION / LABELING:
PHENOTYPE:
|

Abnormal distribution and glycosylation of CMAC components in MZtmem2 mutants. (A-G) Immunofluorescence shows localization of paxillin (green; A,B), pFAK (pY397) (red; C,D), βDG (blue; E-G), and glycosylated αDG (green; E-G) relative to muscle fibers, marked with Phalloidin (red; A,B,E-G) or the antibody F310 (green; C,D); lateral views, dorsal up, at 26hpf. (A-D) Both paxillin (B′) and pFAK (D′) are recruited to the MZtmem2 MTJ. However, compared with the concentrated and robust localization in Mtmem2 siblings (A′,C′), paxillin appears disorganized (B′), and pFAK levels are diminished (D′). (E-G) The antibody IIH6, which recognizes a glycosylated epitope of αDG within its laminin-binding site (Ervasti and Campbell, 1993), detects αDG at the MTJ in Mtmem2 siblings (E′), but detects only trace amounts of glycosylated αDG at the MZtmem2 MTJ (F′, Table S3). In contrast, βDG is readily detectable at the MZtmem2 MTJ (F′′). αDG glycosylation can be rescued in MZtmem2 mutants by injection of tmem2 mRNA (G′, Table S3). (H) Bar graph compares immunostaining intensity for glycosylated αDG, relative to levels of βDG, at the MTJ at 26hpf; error bars indicate s.e.m. For each condition, we measured the mean pixel intensity (MPI) of immunostaining at five different MTJs in each of three representative embryos; see also Fig. S5. Introduction of full-length Tmem2, but not the Tmem2 ectodomain, caused improvement in αDG glycosylation in MZtmem2 mutants. Asterisk indicates significant difference from MZtmem2 (Student′s t-test; P<0.005). |
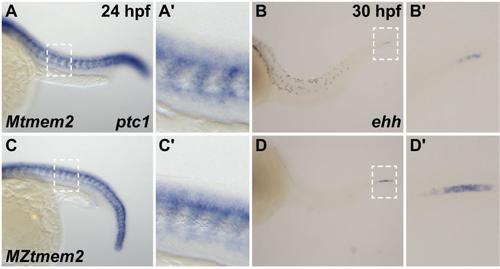
Hedgehog signaling and notochord differentiation are intact in MZtmem2 mutants. (A-D) In situ hybridization depicts expression of ptc1 at 24 hpf (A,C) or ehh at 30 hpf (B,D) in Mtmem2 (A,B) and MZtmem2 (C,D) siblings, lateral views, anterior at left. A′-D′ show closer views of regions outlined by white rectangles in A-D. (A,C) Expression of ptc1 serves as a reporter of Hedgehog signaling. Loss of Hedgehog signaling causes formation of U-shaped somites (Lewis et al., 1999; Schauerte et al., 1998; van Eeden et al., 1996), but Hedgehog signal transduction seems relatively robust in MZtmem2 mutants. (B,D) Notochord maturation is accompanied by loss of expression of ehh, a chordamesoderm marker (Parsons et al., 2002; Stemple, 2005). As notochord differentiation proceeds from anterior to posterior, ehh is visible only at the caudal end of the notochord by 30 hpf (B). The progression of differentiation is relatively normal in MZtmem2 mutants (D), although the slightly increased extent of ehh expression that remains at 30 hpf suggests a slight delay. |
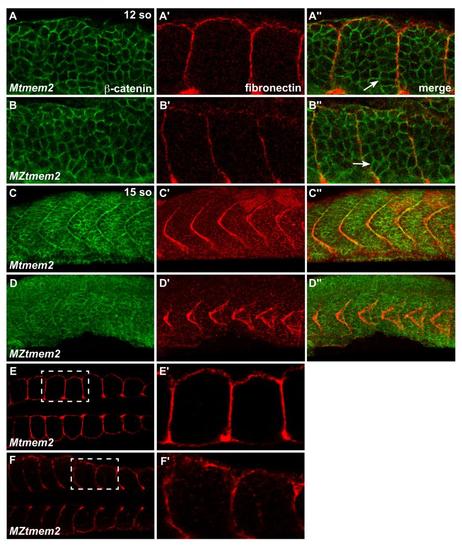
Initial formation of somite borders appears normal in MZtmem2 mutants. (A-F) Immunofluorescence indicates localization of fibronectin (red) relative to β-catenin (green) at 12 so (A-B) and 15 so (C-F). (A-B) Dorsal views, anterior to the left, of the right myotome show fibronectin localization at somite boundaries. In MZtmem2 mutants (B′), fibronectin is deposited at each somite boundary, in a pattern comparable to that seen in Mtmem2 siblings (A′). Additionally, muscle precursor cells at the borders of MZtmem2 somites exhibit characteristic elongation indicative of the formation of epithelial somite boundaries (Henry et al., 2005) (B′′, arrow), just as in Mtmem2 siblings (A′′, arrow). These results suggest that the initial formation of somite boundaries proceeds normally in MZtmem2 mutants. (C-D) Lateral views, dorsal up, display fibronectin localization at somite boundaries at 15 so, when the earliest aberrations in fibronectin organization appear in MZtmem2 mutants. In MZtmem2 mutants (D′), fibronectin is present at somite boundaries, but seems disorganized, in contrast to the sharply defined fibronectin deposition present in Mtmem2 siblings (C′). (E-F) Dorsal views, anterior to the left, indicate that fibronectin is present at somite boundaries at 15 so in MZtmem2 mutants (F), as it is in Mtmem2 siblings (E). E′ and F′ show closer views of regions outlined by white rectangles in E and F. |
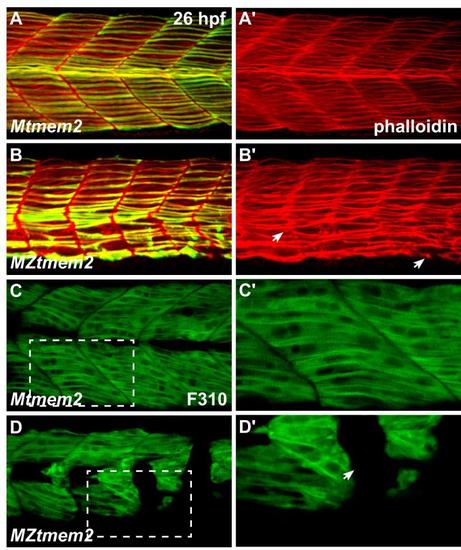
Disruption of fast muscle fiber attachment in MZtmem2 mutants. (A-D) Immunofluorescence reveals muscle fiber organization, using phalloidin (red in A,B) to recognize both fast and slow fibers, F59 (green in A,B) to recognize slow fibers (Devoto et al., 1996), and F310 (green in C,D) to recognize fast fibers (Nord et al., 2014); lateral views, dorsal up, at 26 hpf. (A,B) In addition to exhibiting detachment of F59+ slow muscle fibers (B); see also Fig. 1H), MZtmem2 mutants display detachment of F59- fast muscle fibers (arrows, B′), in contrast to the attached fibers observed in Mtmem2 siblings (A). (C,D) Similarly, MZtmem2 mutants (D) display detachment of F310+ fast muscle fibers (arrow, D2), in contrast to the attachment seen in Mtmem2 siblings (C). C′ and D′ show closer views of regions outlined by white rectangles in C and D. |
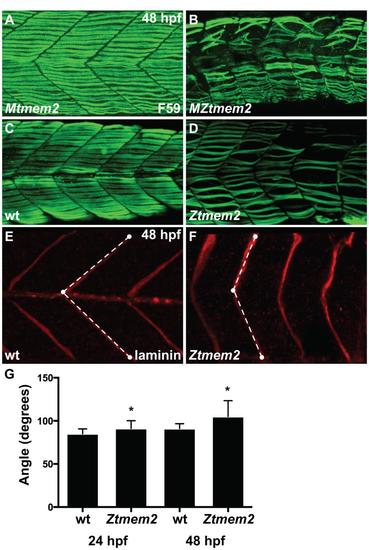
Impairment of muscle fiber organization in zygotic tmem2 mutants. (A-D) Immunofluorescence with F59 (green) reveals slow muscle fiber organization; lateral views with dorsal up at 48 hpf. At this stage, MZtmem2 mutants (B) exhibit detachment and disorganization of slow muscle fibers, in contrast to the normal attachment seen in their Mtmem2 siblings (A). Although we have not observed muscle fiber detachment in zygotic tmem2 (Ztmem2) mutants at 24 hpf (data not shown), we have found fiber detachment and disorganization in some Ztmem2 mutants (D) by 48 hpf (n=4 out of 33 Ztmem2 mutants examined). (E,F) Immunofluorescence detecting laminin (red) deposition at the MTJ reveals somite shape defects in Ztmem2 mutants. In wild-type (E) and Ztmem2 (F) sibling embryos, somite shape was evaluated by measuring the angle formed at the MTJ. White dots represent examples of the reference points chosen at the horizontal myoseptum, the dorsal edge of the MTJ, and the ventral edge of the MTJ; dashed lines represent the angle measured using ImageJ software. (G) Bar graph compares average angles formed at the MTJ in wild-type and Ztmem2 embryos at 24 hpf and 48 hpf (in wild-type, n=85 at 24 hpf and n=75 at 48 hpf; in Ztmem2, n=52 at 24 hpf and n=154 at 48 hpf). Error bars indicate s.d., and asterisks indicate a significant difference from wild-type (Student′s t-test; p<0.0001). Somite shapes in Ztmem2 mutants become less chevron-shaped and more U-shaped over time, presumably as maternal supplies of tmem2 are depleted and muscle fiber defects accumulate. |
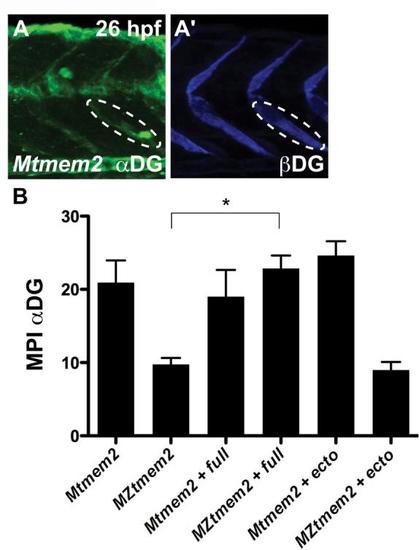
Quantification of intensity of immunostaining for dystroglycan at the MTJ. (A) Confocal reconstruction depicts immunostaining for glycosylated αDG (A) and βDG (A′) in a Mtmem2 embryo at 26 hpf; lateral view, dorsal up. To quantify the intensity of immunostaining through the entire depth of the confocal stack, we used Imaris software to rotate each reconstruction 30 degrees toward the right and then used ImageJ software to measure the mean pixel intensity (MPI) within an oval-shaped region of interest positioned at the MTJ. Ovals of the same size and in the same position were used to measure MPI for both glycosylated αDG and βDG (as outlined in A and A′). (B) Bar graph compares MPI of immunostaining for glycosylated αDG at the MTJ at 26 hpf; error bars indicate s.e.m. For each condition, we measured the MPI at 5 different MTJs in each of 3 representative embryos (Mtmem2: 2 embryos presenting normal staining and 1 embryo presenting traces of staining; MZtmem2: 2 embryos presenting traces of staining and 1 embryo presenting no staining; Mtmem2 + full: 2 embryos presenting normal staining and 1 embryo presenting traces of staining; MZtmem2 + full: 3 embryos presenting normal staining; Mtmem2 + ecto: 3 embryos presenting normal staining; MZtmem2 + ecto: 2 embryos presenting traces of staining and 1 embryo presenting no staining). Introduction of full-length Tmem2, but not the Tmem2 ectodomain, caused evident improvement in αDG glycosylation in MZtmem2 mutants. Asterisk indicates significant difference from MZtmem2 (Student′s t-test; p<0.01). See also Fig. 4H and Table S3. |