
|
Fig. S5
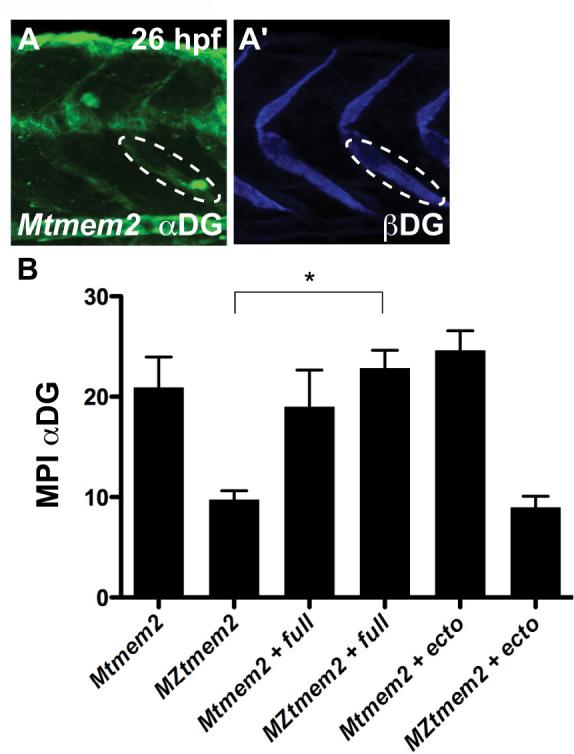
Quantification of intensity of immunostaining for dystroglycan at the MTJ. (A) Confocal reconstruction depicts immunostaining for glycosylated αDG (A) and βDG (A′) in a Mtmem2 embryo at 26 hpf; lateral view, dorsal up. To quantify the intensity of immunostaining through the entire depth of the confocal stack, we used Imaris software to rotate each reconstruction 30 degrees toward the right and then used ImageJ software to measure the mean pixel intensity (MPI) within an oval-shaped region of interest positioned at the MTJ. Ovals of the same size and in the same position were used to measure MPI for both glycosylated αDG and βDG (as outlined in A and A′). (B) Bar graph compares MPI of immunostaining for glycosylated αDG at the MTJ at 26 hpf; error bars indicate s.e.m. For each condition, we measured the MPI at 5 different MTJs in each of 3 representative embryos (Mtmem2: 2 embryos presenting normal staining and 1 embryo presenting traces of staining; MZtmem2: 2 embryos presenting traces of staining and 1 embryo presenting no staining; Mtmem2 + full: 2 embryos presenting normal staining and 1 embryo presenting traces of staining; MZtmem2 + full: 3 embryos presenting normal staining; Mtmem2 + ecto: 3 embryos presenting normal staining; MZtmem2 + ecto: 2 embryos presenting traces of staining and 1 embryo presenting no staining). Introduction of full-length Tmem2, but not the Tmem2 ectodomain, caused evident improvement in αDG glycosylation in MZtmem2 mutants. Asterisk indicates significant difference from MZtmem2 (Student′s t-test; p<0.01). See also Fig. 4H and Table S3.