
- Title
-
Roles of Wnt pathway genes wls, wnt9a, wnt5b, frzb and gpc4 in regulating convergent-extension during zebrafish palate morphogenesis
- Authors
- Rochard, L., Monica, S.D., Ling, I.T., Kong, Y., Roberson, S., Harland, R., Halpern, M., Liao, E.C.
- Source
- Full text @ Development
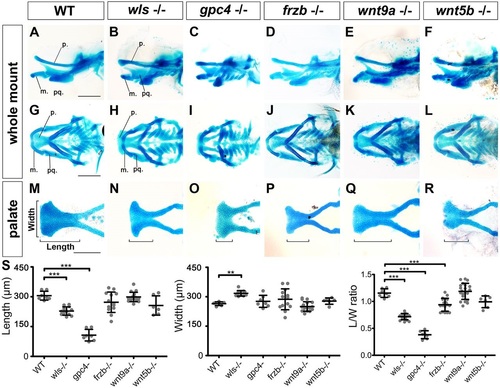
Wnt signaling is required for palate morphogenesis. (A-R) Alcian Blue-stained 4.5dpf zebrafish larvae. (A-F) Lateral, (G-L) ventral, (M-R) detailed view of dissected palate. (S) Length, width and average length/width ratio measured in WT and mutants as illustrated in M. **P<0.01, ***P<0.0001. p, palate; m, Meckel′s; pq, palatoquadrate. PHENOTYPE:
|
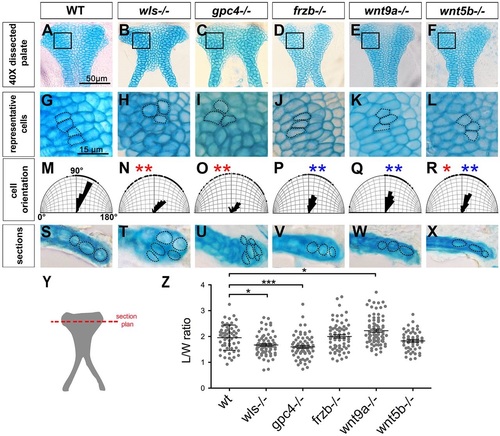
Cell shape and orientation are defective in Wnt signaling mutants. (A-F) Dissected palate (anterior to the top). (G-L) Representative region (as boxed above) magnified to illustrate cell shape and organization. (M-R) Cell orientation was measured and compared with WT (significantly different indicated by red asterisk) and with wls mutant (significantly different indicated by blue asterisk). Watson-U2 test. (S-X) Transverse sections (following the cut plane illustrated in Y) showing chondrocytes stacking in the DV axis. (Z) Graphic representation of the cell L/W ratio. *P<0.05, ***P<0.0001. PHENOTYPE:
|
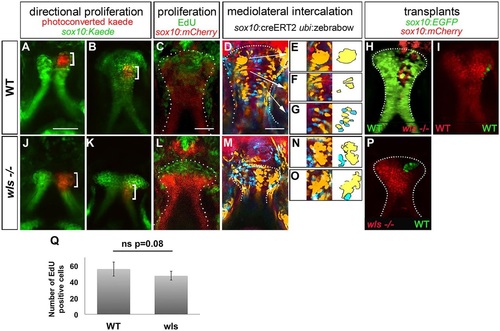
Chondrocytes proliferate normally but fail to intercalate in wls mutants. Anterior is up in all views. (A-I) WT larvae, (J-P) wls mutants. Photoconverted sox10:kaede (red, bracket) in WT (A,B) and wls mutants (J,K) at 55hpf (A,J) and 72hpf (B,K). EdU incorporation assay in WT (C) and wls mutant (L). Multi-spectral clonal analysis in WT (D-G) and wls mutants (M-O). WT chondrocytes undergo a CE from distal to proximal, cells proliferate and group (D,E), converge into columns (D,F) and intercalate (D,G). In wls mutants, cells fail to undergo intercalation (M-O). Yellow and blue groups of cells are illustrated schematically to assist in visualization of the cell intercalation process. (H,I,P) Presumptive cranial NCCs were transplanted from WT sox10:EGFP to wls-/- sox10:mCherry and reciprocally. wls cells intercalated in 4/5 WT (H); WT cells formed groups in 5/6 mutants (P). (I) Control experiment, from WT sox10:EGFP to sox10:mCherry WT. (Q) Quantification of EdU-positive cells. Six WT and five wls mutant embryos were used and positive cells were counted for each. Average of number positive cells were calculated. ns, not significant (Student′s t-test). EXPRESSION / LABELING:
PHENOTYPE:
|

Genetic interactions between wls, gpc4, wnt9a, wnt5b and frzb regulate palate morphogenesis. (A-L) Anterior is up. Dissected palates (A-F) and magnified views (G-L) showing cell size, organization and orientation. (M-R) Cell orientation was measured and compared with WT (significantly different indicated by red asterisk) and with wls mutant (significantly different indicated by blue asterisk). (S,T) Length, width and length/width ratio measured in cells (S) and palate (T). *P<0.05, **P<0.01, ***P<0.0001. (U) Summary of relative contributions of each gene to palate morphogenesis. The principal axes of the palate are diagramed and the chart beneath summarizes the morphogenetic processes involved in palate development. |
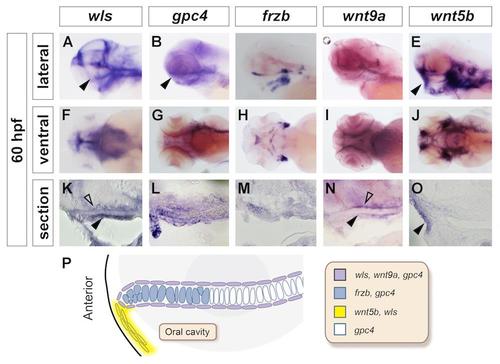
Expression pattern of non-canonical Wnt genes during craniofacial development. Whole mount in situ hybridization with head to the left in lateral view (A-E), ventral view (F-J) and sagittal section (K-O). At 60hpf, during palate morphogenesis, wls (A, F and K) is co-expressed with wnt9a (D, I, N) and gpc4 (B, G, L) in the oral epithelium surrounding chondrocytes and tissue above the palate. frzb (C, H, M) transcripts are detected in the chondrocytes at the distal tip of the palate. wnt5b (E, J and O) expression is detected in the oral epithelium at the mouth opening region. P: Summary of gene expression domains and their spatial relationships. |
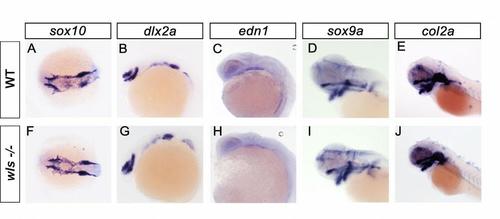
Early neural crest development and patterning are unaffected in wls-/-. Whole mount in situ hybridization of the indicated genes in wild-type and wls-/- embryos with head to the left in dorsal view (A,F) and lateral view (B-E, G-J). At all stages and genes examined, the expression does not differe between wild-type and wls-/- mutants. Markers used: sox10: early cNCC; dlx2a: migrating cNCCs; edn1: cNCC migration; sox9: cartilage formation; col2a: cartilage formation. |