
- Title
-
A Zebrafish model of human manganism points to specific deficits in sensory, motor, and neuro-modulatory functions
- Authors
- Bakthavatsalam, S., Das Sharma, S., Sonawane, M., Thirumalai, V., Datta, A.
- Source
- Full text @ Dis. Model. Mech.

Postural, morphological and swim defects in Mn-exposed zebrafish larvae. (A) Scheme representing the treatment protocol. (B) Control 5-dpf larva showing a normal swim bladder (blue arrow). (C) Mn-treated larvae showing an underdeveloped swim bladder. (D) Body position and morphology of free-swimming larvae: (i) control, (ii) Mn-treated and (iii) recovered larvae. Curvature of the spine (green arrow) and sideways floating (red arrow) were observed upon Mn exposure (middle panel). (E) Percentage survival for larvae treated for 24 (blue) or 48 hours (red) with Mn. When larvae were treated with 2 mM MnCl2 for 48 hours, 50% survival was observed (n=20, six batches). (F) The percentage of live larvae that exhibited spontaneous (circles) and stimulated (triangles) circular swimming patterns (CP) at different levels of Mn exposure. Spontaneous CP completely recovers after removal from Mn-containing medium, whereas ‘on-tap’ CP partially recovers. Statistical analyses were performed by using chi-square test to compare recovered with Mn-treated larvae (n=20, three batches). (G) The percentage of live larvae that demonstrated stimulated CP upon 48 hours of exposure to different metal ions: MnCl2 (blue), CaCl2 (green), NaCl (red) and MgCl2 (purple). Error bars in the plots represent s.e.m. PHENOTYPE:
|
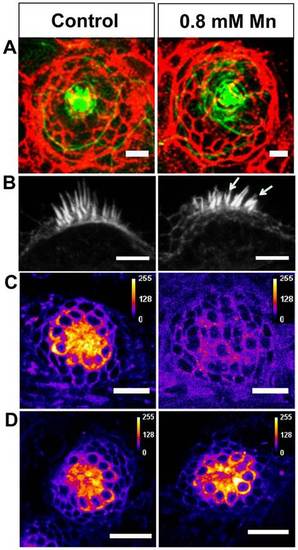
Effect of Mn exposure on neuromast structure and function. (A) Confocal images of a representative neuromast in the anterior lateral line of control and Mn-treated (48-hour exposure) larvae. Cell membranes immunostained for E-cadherin (red), and actin filaments stained with phalloidin (green) are depicted as a merged image that was generated by choosing z planes with maximum intensities for each dye. (B) Confocal images of representative otic neuromasts highlighting splayed stereocilia (arrows) in an Mn-treated larva. (C,D) Confocal images of a representative neuromast in the anterior lateral line of larvae stained with FM 1-43 FX dye. Images indicate a particular z plane at which maximal staining was observed for control (C and D, left), Mn-treated (48-hour exposure) (C, right) and recovered (48 hours in Mn-free medium following Mn exposure) (D, right) larvae. FM-dye uptake was suppressed upon Mn exposure. Scale bars: 25 µm (A,C,D); 5 µm (B). |

Altered frequency and duration of trunk movements in Mn-exposed larvae. (A) Still frames from a 20-second movie recorded at 300 fps in a head-embedded larva. The angle between head ‘H’, mid trunk ‘M’ and tail ‘T’ was used as a measure of the extent of trunk movement when the larva was exhibiting (i) a resting state (180°), (ii) wagging (<200°, supplementary material Movie 2) and (iii) large-angle movements (LAM) (>200°, supplementary material Movies 3, 4). The trunk movement angle plotted against time for (B) control larvae, (C) Mn-treated (48-hour exposure to 1 mM MnCl2) and (D) recovered (24-hour recovery following Mn exposure) larvae. (E) Average number of LAMs within a 20-second period plotted for control (n=5), Mn-treated (n=7) and recovered (n=7) larvae. Error bars indicate s.e.m. Statistical analysis was performed by using Wilcoxon rank sum test with Bonferroni correction for multiple comparisons. *P=0.0025; NS, non significant. (F) Stacks of expanded plots of LAMs and short wags in control (green) and Mn-exposed larvae (red). The black line represents the resting position. Angles above the line depict left-directed movements and angles below the line depict right-directed movements. Alternate consecutive left and right LAM patterns, and clusters of unidirectional LAMs were observed in control larvae, whereas Mn-exposed larvae exhibited single LAMs which were not immediately followed by other LAMs. (G) Cumulative probability distribution of LAM durations for control (green), Mn-treated (48-hour exposure, red) and recovered (24 hours in Mn-free medium following Mn exposure, blue) larvae indicating that control and recovered larvae displayed shorter duration LAMs, whereas Mn-treated larvae displayed longer duration LAMs (P<0.0001). Statistical analysis was performed using Kruskal–Wallis ANOVA. PHENOTYPE:
|
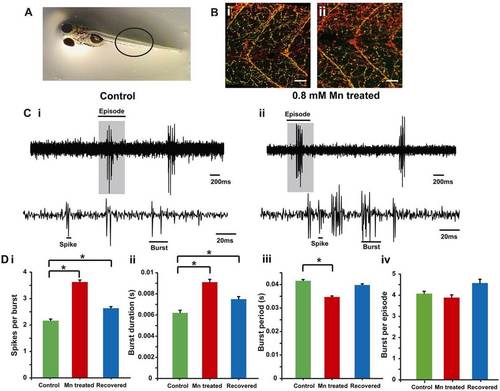
Morphology and function of motor neurons. (A) Zebrafish larvae, the region where ZNP-1 antibody and α-bungarotoxin staining was visualized (black circle) is highlighted. (B) A single optical slice showing ZNP-1 staining (red) and α-bungarotoxin staining (green, colocalized as yellow) of motor neuron innervation of axial muscles in (i) control and (ii) Mn-treated (48-hour exposure) larvae. The staining indicates similar motor neuronal axon morphology between the two groups. Scale bars: 30 µm. (C) Extracellular recordings of fictive swim patterns on motor neurons highlight that episodes comprise bursts and spikes in (i) control and (ii) Mn-treated larvae. The top traces show episodes of swim motor patterns. The episode highlighted by a gray box is shown expanded in the bottom traces. (D) Bar plots for (i) the number of spikes per burst, (ii) the burst duration, (iii) the burst period and (iv) the number of bursts per episode in control (green), Mn-treated (red) and recovered (blue) larvae. Data represent mean±s.e.m. *Values that are significantly different from control at an α level of 0.05 as estimated by using the Kruskal–Wallis test. |
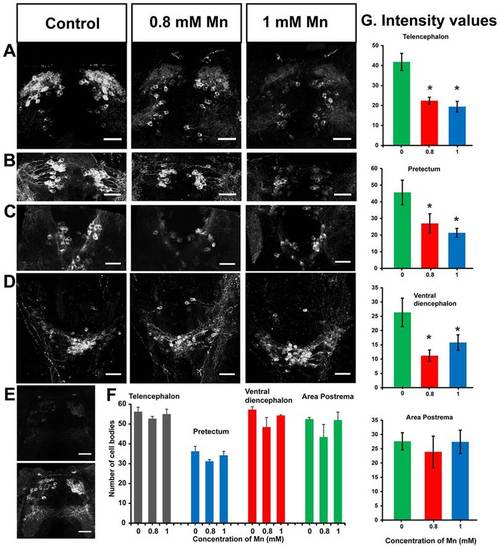
Reduction in tyrosine hydroxylase immunoreactivity upon Mn exposure. (A–D) Confocal images of catecholaminergic neurons comprising of dopaminergic and noradrenergic neurons in 5-dpf larvae (dorsal view) stained with an antibody against tyrosine hydroxylase showing a reduction in staining upon 48 hours of exposure to Mn. Maximum intensity projection (z-axis) images of tyrosine hydroxylase immunoreactivity in (A) telencephalon, (B) pretectum, (C) ventral diencephalon and (D) area postrema. (E) A single optical slice showing tyrosine hydroxylase immunoreactivity in the telencephalon of an Mn-exposed larva before (top) and after (bottom) image intensity multiplication. Scale bars: 30 µm. (F) The number of tyrosine-hydroxylase-immunoreactive cell bodies in different regions of 5-dpf larvae exposed to the indicated concentrations of Mn showed no significant differences in cell counts (n=4; telencephalon P=0.50; pretectum P=0.23; ventral diencephalon P=0.057 for control and those treated with 0.8 mM Mn, and P=0.23 for control and those treated with 1 mM Mn; and area postrema P=0.31). Error bars represent s.e.m. Statistical tests were performed using ANOVA and Wilcoxon rank sum test with Bonferroni correction for multiple comparisons. (G) Bar plots indicating the average intensities of tyrosine hydroxylase immunostaining in control larvae and Mn-treated larvae from identical ROIs drawn in the regions indicated on top of each plot. Error bars represent s.e.m. RMANOVA and Freidman tests were performed to calculate statistical significance. *Values that are significantly different from control at an α level of 0.05. EXPRESSION / LABELING:
|
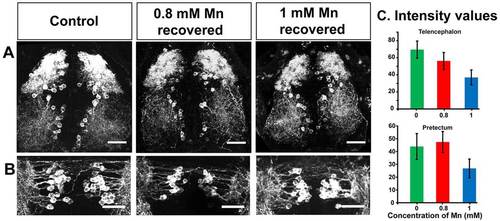
Recovery of tyrosine hydroxylase immunoreactivity. (A,B) Tyrosine hydroxylase immunoreactivity recovers when Mn is removed from the rearing medium. Confocal maximum intensity projection (z-axis) images of catecholaminergic neurons of control and recovered larvae (dorsal view) stained with an antibody against tyrosine hydroxylase depicting the (A) telencephalon and (B) pretectum regions. Scale bars: 30 µm. (C) Bar plots representing the average intensity of tyrosine hydroxylase immunostaining in recovered larvae compared to that of control larvae from identical ROIs drawn in the regions indicated at the top of each plot. Error bars represent s.e.m. RMANOVA was used to calculate statistical significance. P=0.0908 and 0.2002 for telencephalon region and prectum region, respectively. EXPRESSION / LABELING:
|