
|
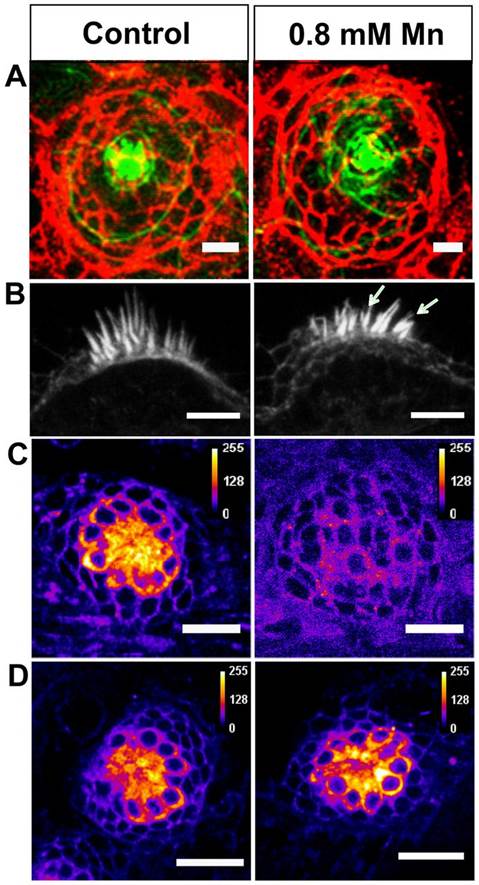
Fig. 2 Effect of Mn exposure on neuromast structure and function. (A) Confocal images of a representative neuromast in the anterior lateral line of control and Mn-treated (48-hour exposure) larvae. Cell membranes immunostained for E-cadherin (red), and actin filaments stained with phalloidin (green) are depicted as a merged image that was generated by choosing z planes with maximum intensities for each dye. (B) Confocal images of representative otic neuromasts highlighting splayed stereocilia (arrows) in an Mn-treated larva. (C,D) Confocal images of a representative neuromast in the anterior lateral line of larvae stained with FM 1-43 FX dye. Images indicate a particular z plane at which maximal staining was observed for control (C and D, left), Mn-treated (48-hour exposure) (C, right) and recovered (48 hours in Mn-free medium following Mn exposure) (D, right) larvae. FM-dye uptake was suppressed upon Mn exposure. Scale bars: 25 µm (A,C,D); 5 µm (B).