
|
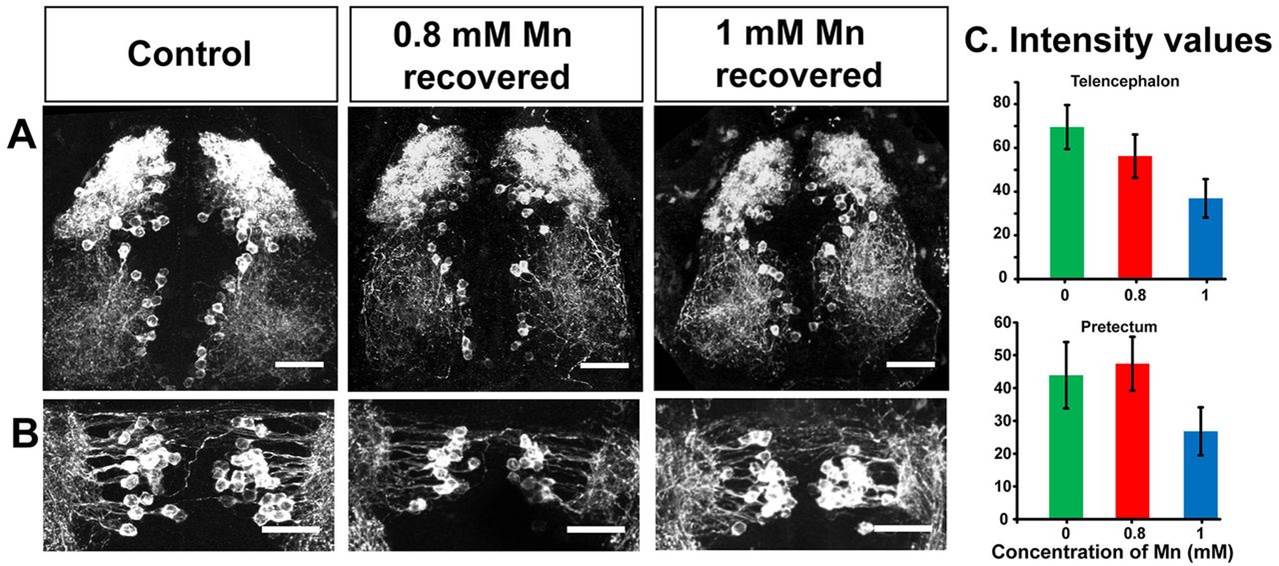
Fig. 6 Recovery of tyrosine hydroxylase immunoreactivity. (A,B) Tyrosine hydroxylase immunoreactivity recovers when Mn is removed from the rearing medium. Confocal maximum intensity projection (z-axis) images of catecholaminergic neurons of control and recovered larvae (dorsal view) stained with an antibody against tyrosine hydroxylase depicting the (A) telencephalon and (B) pretectum regions. Scale bars: 30 µm. (C) Bar plots representing the average intensity of tyrosine hydroxylase immunostaining in recovered larvae compared to that of control larvae from identical ROIs drawn in the regions indicated at the top of each plot. Error bars represent s.e.m. RMANOVA was used to calculate statistical significance. P=0.0908 and 0.2002 for telencephalon region and prectum region, respectively.