
- Title
-
Mutation of zebrafish dihydrolipoamide branched-chain transacylase E2 results in motor dysfunction and models maple syrup urine disease
- Authors
- Friedrich, T., Lambert, A.M., Masino, M.A., and Downes, G.B.
- Source
- Full text @ Dis. Model. Mech.
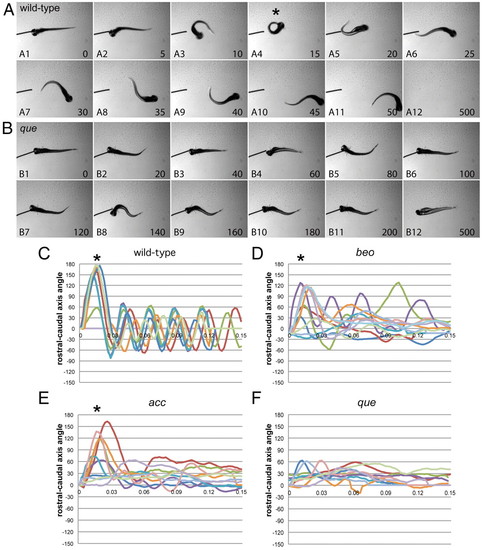
que mutants exhibit abnormal swimming behavior at 96 hpf. (A,B) Selected frames from high-speed video recordings are shown with times indicated in milliseconds. (A) A wild-type larva demonstrates a normal C-bend (A4, asterisk) in response to a touch stimulus, followed by smaller-amplitude body undulations to clear the field (A5-A12). (B) A que mutant demonstrates abnormal rostro-caudal shortening and it fails to escape. (C–F) Kinematic traces are shown, with zero degrees indicating a straight body and positive and negative angles representing body bends in opposite directions. Time is shown in seconds. Ten representative traces are shown for each phenotype. (C) Wild-type embryos typically perform a C-bend (defined here as greater than 110°; asterisks) followed by smaller-amplitude body undulations. (D) bandoneon (beo) mutants, which contain a CNS defect and demonstrate behavior similar to que, sometimes perform a C-bend followed by abnormal body bends. (E) accordion (acc) mutants, which contain a muscle relaxation defect and also demonstrate behavior similar to que, sometimes perform a C-bend but fail to perform smaller-amplitude body bends. (F) que mutants rarely perform a C-bend and demonstrate few smaller-amplitude body undulations. PHENOTYPE:
|
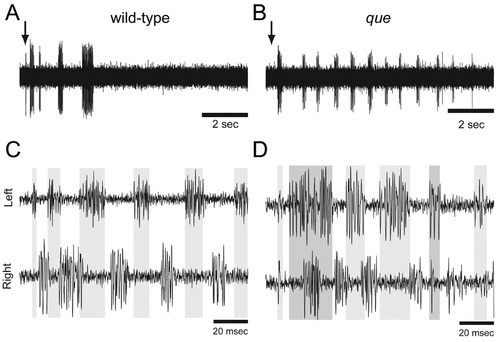
The spinal locomotor output is altered in que mutants. (A,B) Representative single extracellular peripheral nerve recordings from (A) wild type and (B) a que mutant. que mutants produce a greater number of bouts following a gentle tap to the head (arrow) than do wild type. (C,D) Representative paired (left-right) extracellular peripheral nerve recordings in which (C) wild type fish demonstrate tightly coordinated bursting activity with little overlap. By contrast, (D) que mutants generate greater bursting overlap. Gray bars denote burst activity in the top trace and extend to the bottom trace for ease of comparison. PHENOTYPE:
|
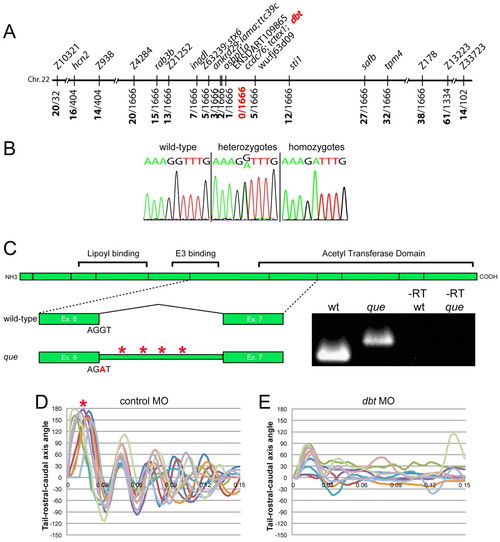
Theque gene encodes dihydrolipoamide branched-chain transacylase E2 (Dbt), a subunit of the BCKD complex. (A) que maps to a 0.36 cM interval on chromosome 22. Molecular markers are shown at the top and the number of recombinants out of the number of meiotic events are shown at bottom. dbt was positioned within the zero recombinant interval. (B) Chromatogram sequence traces of dbt from wild-type, hetero-and homozygous mutant larvae. The nucleotide substitution at the exon-intron boundary (G to A) can be observed in hetero- and homozygotes. (C) A schematic of the dbt protein is shown with the boundaries between exons indicated as vertical lines. Protein domains, including the acetyl transferase domain, are also shown. Below, the wild-type splice pattern is illustrated, with protein-coding exon 6, the sequence at the splice site, the intervening intron, and protein-coding exon 7 depicted. The que mutant splicing pattern is also illustrated, including the nucleotide substitution, which results in a failure to remove the intron. The intron contains four stop codons (asterisks). RT-PCR results using mRNA from wild type, que mutants and –RT controls are also shown using primers targeted towards exon 6 and exon 7. A larger DNA product, containing intron sequence, can be observed using mRNA isolated from que mutants. (D,E) Ten kinematic traces are shown for embryos injected with (D) the control morpholino or (E) a dbt translation-blocking morpholino. Embryos injected with the control morpholino perform C-bends (asterisk) and normal swimming behavior. dbt morphant embryos demonstrate abnormal swimming behavior and few large amplitude body bends, similar to que mutants. PHENOTYPE:
|
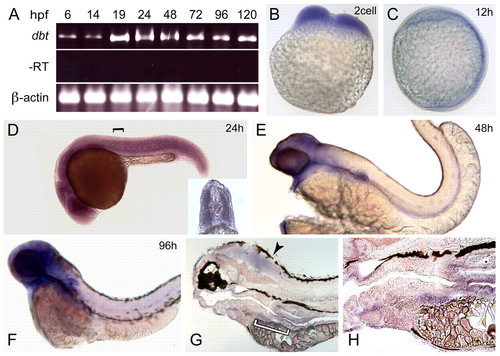
dbt becomes enriched in the brain and organs in the gut across development. (A) RT-PCR results are shown using mRNA isolated at different time points during zebrafish development. dbt was detected at all stages examined. –RT and β-actin controls are also shown. (B–H) In situ hybridization shows broad dbt expression at (B) the two-cell stage, (C) 12 hpf and (D) 24 hpf. The inset of a cross-section (the black bracket indicates the approximate level of the cross-section) reveals robust dbt expression in muscle. dbt expression become enriched in the brain and gut at (E) 48 hpf and (F) 96 hpf. (G) Sagittal sections of stained 96 hpf embryos illustrate expression in the brain (arrowhead) and gut. The white bracket indicates a portion of the region shown at higher magnification in H. Above the left edge of the white bracket, dbt expression in the liver can be observed, whereas above the right edge of the white bracket, dbt expression in the intestine is revealed. |
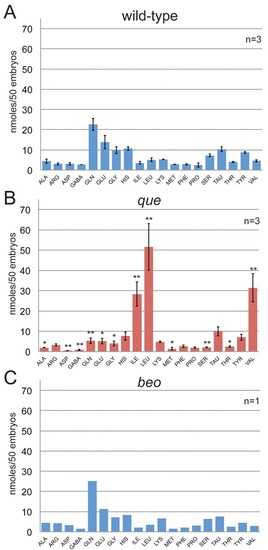
The free amino acid profile of que mutants shows elevated levels of BCAAs at 96 hpf. The amino acids are referred to by their three-letter code, except for GABA. Each experiment contained a homogenate of 50 larvae. The error bars indicate standard error. (A) The free amino acid profile for wild-type larvae (n=3). (B) The free amino acid profile of que mutant larvae reveals a dramatic accumulation of BCAAs: isoleucine, leucine and valine. Other amino acid levels were reduced. * Significant difference from wild-type at P<0.05; ** significant difference from wild-type at P<0.01 (n=3). (C) The free amino acid profile of beo, a zebrafish mutant that demonstrates abnormal behavior owing to a CNS defect, indicates that abnormal behavior alone does not markedly alter free amino acid levels (n=1). PHENOTYPE:
|
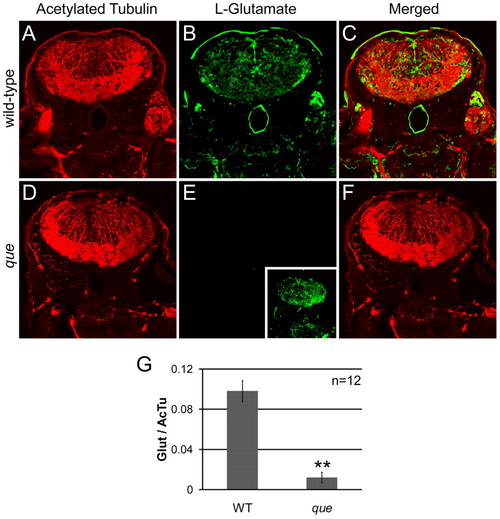
que mutants contain a reduced concentration of glutamate in the brain. (A–F) Cross-sectional views of the hindbrain of 96 hpf larvae are shown. Immunohistochemistry using antibodies against acetylated tubulin, which predominantly labels axon tracts, reveals the overall structure of the brain and demonstrates tissue penetration of the antibodies. Staining using an antibody against L-glutamate illustrates the distribution of this neurotransmitter. (A) Labeling with the anti-acetylated tubulin reveals the axon tracts and overall structure of the hindbrain of wild-type larvae. (B) The hindbrain of wild-type larvae contains a broad distribution of L-glutamate. (C) The merged images show several L-glutamate-positive cells surrounded by anti-acetylated tubulin labeling. (D) The overall structure of the hindbrain of que mutants revealed by anti-acetylated tubulin appears similar to the hindbrain wild-type larvae. (E) The fluorescence intensity of labeling with the L-glutamate antibody is greatly reduced compared with wild type when imaged using the same microscope settings. However, increasing the gain of the confocal microscope shows more faint L-glutamate staining (inset). (F) The merged images show little L-glutamate staining compared with acetylated tubulin labeling. (G) The graph shows a significant reduction in L-glutamate staining intensity in que mutants normalized to acetylated tubulin staining. The fluorescent intensity values are the analog-to-digital converter values of the entire frame (n=5 embryos, 12 sections, **P<0.01). Very similar results were obtained when a region of interest was selected to encompass a smaller, designated portion of the brain. EXPRESSION / LABELING:
|

Unillustrated author statements PHENOTYPE:
|