
- Title
-
Fgf and Hh signalling act on a symmetrical pre-pattern to specify anterior and posterior identity in the zebrafish otic placode and vesicle
- Authors
- Hammond, K.L., and Whitfield, T.T.
- Source
- Full text @ Development
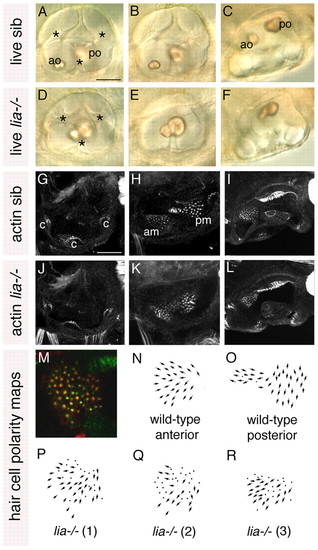
Anterior otic character is reduced in lia-/- (fgf3-/-) homozygotes. (A-F) Live 72 hpf lia-/- and sibling (sib) zebrafish inner ears. (G-L) Confocal z-stacks of 84 hpf ears stained with FITC-phalloidin to mark sensory hair cells. (M) The anterior macula of a 5 dpf lia-/- embryo stained with anti-acetylated tubulin antibody (kinocilia; red) and FITC-phalloidin (stereocilia; green). (N,O) Typical polarity maps for wild-type maculae. (P) Hair cell polarity map obtained from the specimen shown in M. (Q,R) Polarity maps from two further lia-/- specimens. A,B,D,E,G,H,J,K: Lateral views; anterior to left, dorsal to top. A,D,G,J: Lateral focal plane. B,E,H,K: Medial focal plane. C,F,I,L: Dorsal views; anterior to left, medial to top. am, anterior macula; ao, anterior otolith; c, cristae; pm, posterior macula; po, posterior otolith. Asterisks indicate semicircular canal pillars. Scale bars: 50 μm. |
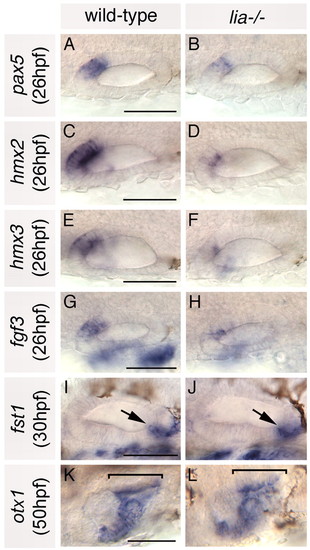
Anterior otic markers are reduced in lia-/- homozygotes; posterior markers are expressed as normal. (A-H) In situ hybridisation to anterior otic markers. (I-L) In situ hybridisation to posterior otic markers (arrows and brackets highlight the posterior otic domains). A-H,K,L: Dorsal views; anterior to left, medial to top. I,J: Lateral views; anterior to left, dorsal to top. Scale bars: 50 μm. |
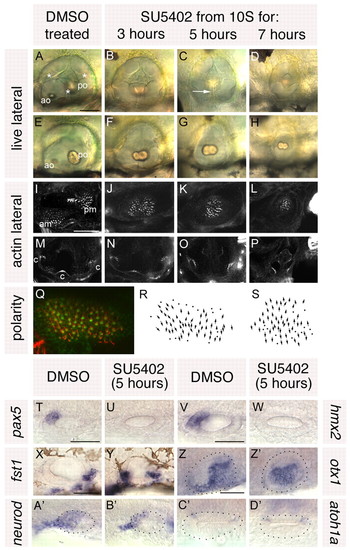
Treatment with SU5402 from 10 to 20S leads to a complete loss of anterior otic structures and a mirror image duplication of posterior otic structures. (A-H) Live ears of 84 hpf zebrafish embryos treated with 10 μM SU5402 and DMSO-treated controls. (I-P) Confocal z-stacks of 84 hpf SU5402-treated and control ears stained with FITC-phalloidin to mark sensory hair cells. (I-L) Medial focal planes showing the maculae. (M-P) Lateral focal planes showing the cristae. (Q) The macula of an 86 hpf SU5402-treated embryo stained with anti-acetylated tubulin antibody (kinocilia; red) and FITC-phalloidin (stereocilia; green). (R) Hair cell polarity map obtained from the macula shown in Q. (S) Polarity map obtained from a further SU5402-treated specimen. (T-W) In situ hybridisation to the anterior otic markers pax5 (T,U) and hmx2 (V,W). (X-Z′) In situ hybridisation to the posterior otic markers fst1 (X,Y) and otx1 (Z,Z′). (A′,B′) In situ hybridisation to neurod, which marks the statoacoustic ganglion. (C′,D′) In situ hybridisation to atoh1a, which marks the first hair cells. A-P,X,Y: Lateral views; anterior to left, dorsal to top. T-W,Z-D′: Dorsal views; anterior to left, medial to top. am, anterior macula; ao, anterior otolith; c, cristae; pm, posterior macula; po, posterior otolith. Asterisks in A indicate semicircular canal pillars; arrow in C indicates reduced lateral semicircular canal pillar. Dots in Z-D′ delineate the otic vesicle. Scale bars: 50 μm. |
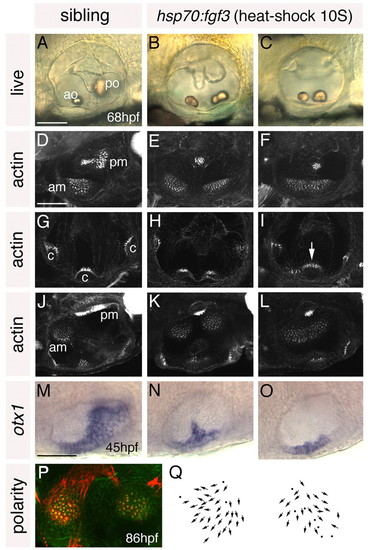
Heat shock of hsp70:fgf3 embryos at 10S leads to a complete loss of posterior otic domains and a mirror image duplication of anterior otic structures. (A-C) Ears of live 68 hpf hsp70:fgf3 and control wild-type zebrafish embryos heat-shocked at 10S. (D-L) Confocal z-stacks of 4 dpf ears stained with FITC-phalloidin to mark sensory hair cells. (D-F) Lateral focal planes showing the maculae. (G-I) Medial focal planes showing the cristae. (J-L) Dorsal views. (M-O) In situ hybridisation to otx1. (P) The macula of an 86 hpf heat-shocked hsp70:fgf3 embryo stained with anti-acetylated tubulin antibody (kinocilia; red) and FITC-phalloidin (stereocilia; green). (Q) Hair cell polarity maps obtained from the maculae shown in P. A-I: Lateral views; anterior to left, dorsal to top. J-Q: Dorsal views; anterior to left, medial to top. am, anterior macula; ao, anterior otolith; c, cristae; pm, posterior macula; po, posterior otolith. Arrow in I marks the lateral crista, which is enlarged. Scale bars: 50 μm. |
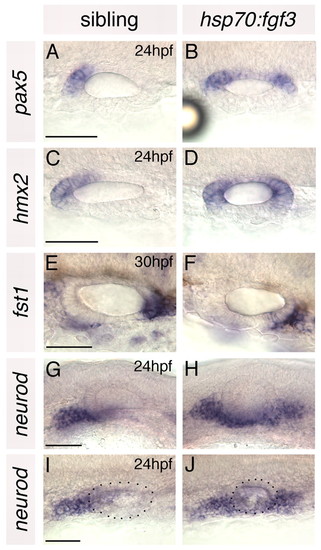
Anterior otic markers are duplicated and posterior otic markers lost in hsp70:fgf3 zebrafish embryos heat-shocked at 10S. (A-F) In situ hybridisation to anterior and posterior otic markers. (G-J) In situ hybridisation to neurod, which marks delaminating neuroblasts and nascent neurons of the statoacoustic ganglion. A-F,I,J: Dorsal views; anterior to left, medial to top. G,H: Lateral views; anterior to left, dorsal to top. Dots delineate the outline of the otic vesicle in I and J. Scale bars: 50 μm. |
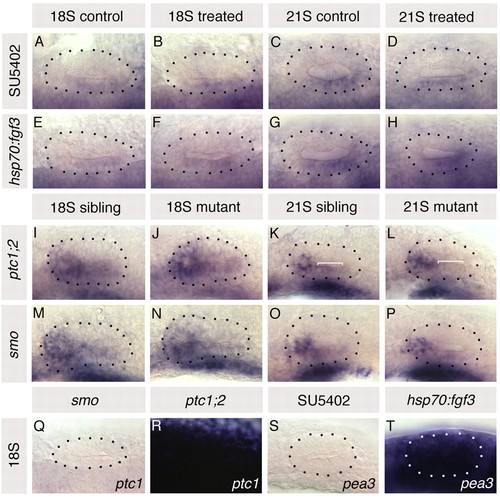
Altering Fgf and Hh signalling in the embryo does not affect otic expression of ptc1 and pea3, respectively. (A-H) ptc1 expression in hsp70:fgf3 compared with wild-type sibling zebrafish embryos heat-shocked at 10S, and in 10 μM SU5402-treated embryos compared with control DMSO-treated embryos treated from 10 to 20S. (I-P) pea3 expression in otic vesicles of ptc1-/-;ptc2-/- and smo-/- embryos compared with siblings. (Q,R) ptc1 expression in smo-/- and ptc1-/-;ptc2-/-embryos. (S,T) pea3 expression in 10 μM SU5402-treated and in hsp70:fgf3 embryos heat-shocked at 10S. A-H,Q,R: Dorsal views; anterior to left, lateral to top. I-P,S,T: Lateral views; anterior to left, dorsal to top. Dotted lines delineate otic vesicle outlines. Bracket in K marks low-level pea3 expression, lost from 21S ptc1 |
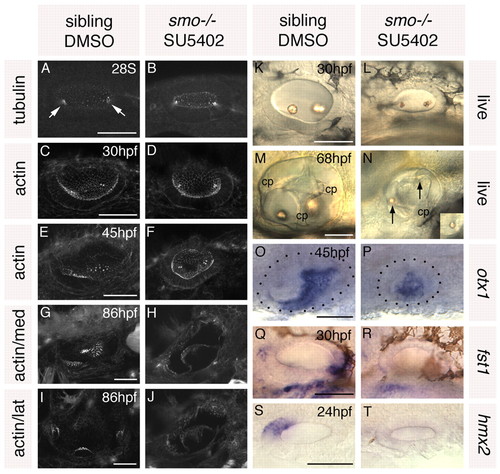
Treatment of smo–/– embryos with SU5402 from 10 to 20S leads to a loss of anterior and posterior otic character. Ears of smo–/– and sibling zebrafish embryos treated with 10 μM SU5402 and DMSO, respectively, from 10 to 20S. (A,B) Anti-acetylated tubulin antibody stain marking the kinocilia of the first-forming hair cells (arrows). (C-J) FITC-phalloidin stain marking cell outlines and stereociliary bundles of the sensory hair cells. (C-F) Views of the whole vesicle. (G,H) Medial views showing the maculae. (I,J) Lateral views showing the cristae. (K-N) Inner ears of live embryos. Arrows indicate otoliths. cp, semicircular canal projection tissue. (O-T) In situ hybridisation to anterior and posterior otic markers. Dots delineate the otic vesicle in O and P. O,P,S,T: Dorsal views; anterior to left, medial to top. A-N,Q,R: Lateral views; anterior to left, dorsal to top. Scale bars: 50 μm. |
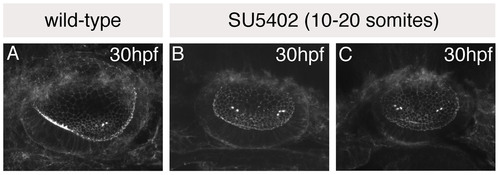
The single medial macula in SU5402-treated otic vesicles originates as two separate groups of hair cells. (A-C) Otic vesicles stained with FITC-phalloidin to reveal the actin-rich stereociliary bundles of sensory hair cells. (A) Wild-type (DMSO-treated) control, showing anterior hair cells in a ventral position, and posterior hair cells in a medial position. (B,C) SU5402-treated embryos treated with 10 μM SU5402 for 5 hours from 10 to 20S; two examples are shown. Two groups of hair cells (towards the anterior and posterior of the vesicle) are detected in SU5402-treated otic vesicles, as in controls; however, these are both positioned medially, resembling the posterior patch in control embryos. Lateral views; anterior to the left. |
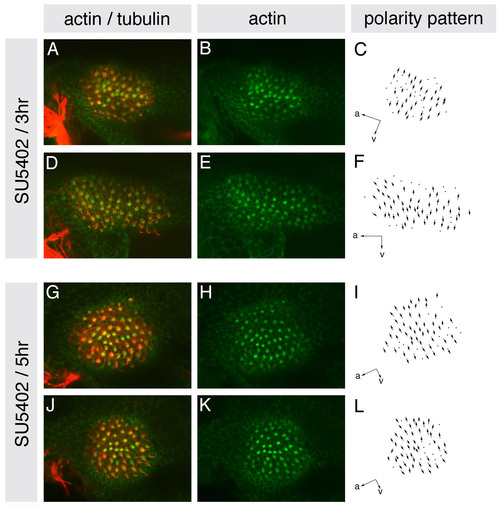
Hair cell polarities in the entire medial macula of SU5402-treated embryos resemble those in the posterior macula of wild-type embryos. (A-L) Maculae of embryos treated with 10 μM SU5402 for either 3 or 5 hours from the 10S stage, stained at 86 hpf with anti-acetylated tubulin antibody to mark the kinocilia (red) and FITC-phalloidin to mark the actin-rich stereocilia (green) of each hair cell. (A,D,G,J) Confocal z-stacks showing overlaid tubulin and phalloidin stains. (B,E,H,K) Single channel z-stacks showing phalloidin stain only. (C,F,I,L) Polarity maps obtained from the phallodin/tubulin-stained specimens. Orientations are shown by arrows; a, anterior; v, ventral. |
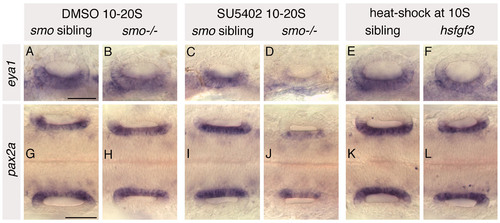
Expression of medial and ventral otic markers in heat-shocked hsp70:fgf3, SU5402-treated wild-type and SU5402-treated smo-/- embryos. Phenotypically wild-type sibling and smo-/- mutant embryos were treated from 10 to 20S with 10 μM SU5402/0.5% DMSO. Control sibling and smo-/- mutant embryos were treated with 0.5% DMSO from 10 to 20S. hsp70:fgf3 transgenic and sibling embryos were heat-shocked at 10S. (A-F) In situ hybridisation to eya1, a marker of ventral otic territories, in 24 hpf embryos. (G-L) In situ hybridisation to pax2a, a marker of medial otic territories, in 25S embryos. Both eya1 and pax2a are expressed in their normal otic domains in all treated and heat-shocked embryos; however, levels of both are severely reduced in otic vesicles of SU5402-treated smo-/- embryos. A-F: Lateral views; anterior to left, dorsal to top. G-L: Dorsal views; anterior to left. Both ears are shown. Scale bars: 50 μm for all panels in a row. |
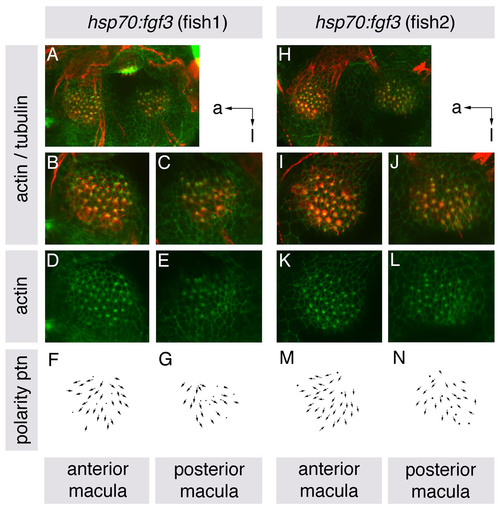
Hair cell polarities in both ventral maculae of heat-shocked hsp70:fgf3 embryos resemble those in the anterior macula of wild-type embryos. (A-N) Maculae of hsp70:fgf3 embryos heat-shocked at 10S, and stained at 86 hpf with anti-acetylated tubulin antibody to mark the kinocilia (red) and FITC-phalloidin to mark the actin rich stereocilia (green) of each hair cell. (A-C,H-J) Confocal z-stacks showing overlaid tubulin and phalloidin stains. B,C,I,J show enlarged views of the anterior and posterior maculae of the ears shown in A and H. (D,E,K,L) Single channel z-stacks showing phalloidin stain only. (F,G,M,N) Polarity maps obtained from the phalloidin/tubulin stained specimens. Orientations shown by arrows: a, anterior; l, lateral. |
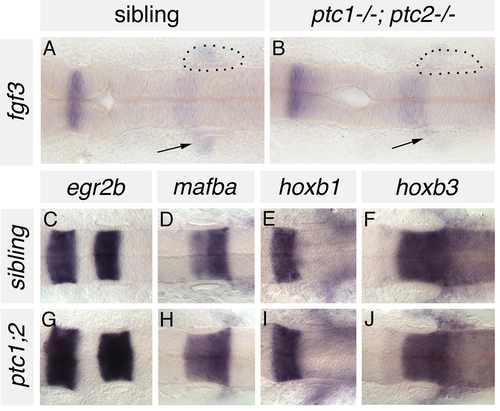
Anteroposterior patterning is grossly normal in the hindbrain of ptc1-/-; ptc2-/- embryos. (A,B) In situ hybridisation to fgf3 in ptc1-/-; ptc2-/- embryos and wild-type siblings at 19S. Expression is reduced in the branchial arches (underneath the ear) of ptc1-/-; ptc2-/- embryos (arrows), but expressed at normal levels in rhombomere 4, adjacent to the anterior part of the developing inner ear. (C-J) In situ hybridisation to a panel of AP-restricted hindbrain markers in 22S ptc1-/-; ptc2-/- embryos and wild-type siblings. Expression of egr2b (krox20; rhombomeres 3 and 5), mafba (rhombomeres 5/6), hoxb1 (rhombomere 4) and hoxb3 (rhombomeres 5, 6 and more posteriorly) is grossly normal in the hindbrain of ptc1-/-;ptc2-/- embryos. Dorsal views; anterior to left. Dots delineate the otic vesicle in A and B. |
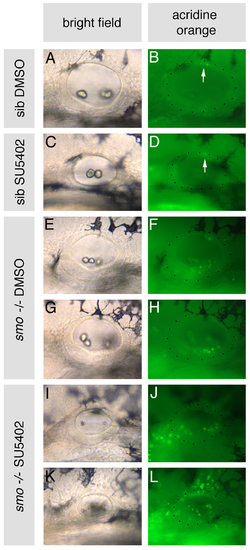
Cell death is increased in otic vesicles of smo-/- embryos treated with SU5402. smo-/- and sibling (sib) embryos were treated with 10 μM SU5402 from 10 to 20S, stained with Acridine Orange for 1 hour between 38.5 and 39.5 hpf and imaged at 40 hpf. (A-D) Siblings treated with DMSO or SU5402 have negligible cell death in the otic vesicle; one or two dying cells are sometimes visible dorsally (arrow). (E-H) smo-/- embryos treated with DMSO display increased cell death in the otic vesicle ventrally, concentrated towards the posterior. (I-L) smo-/- embryos treated with SU5402 display increased cell death within the otic vesicle, at both the anterior and posterior, as well as around the otic vesicle. Lateral views; anterior to left, dorsal to top. Dots delineate the outline of the otic vesicle. |
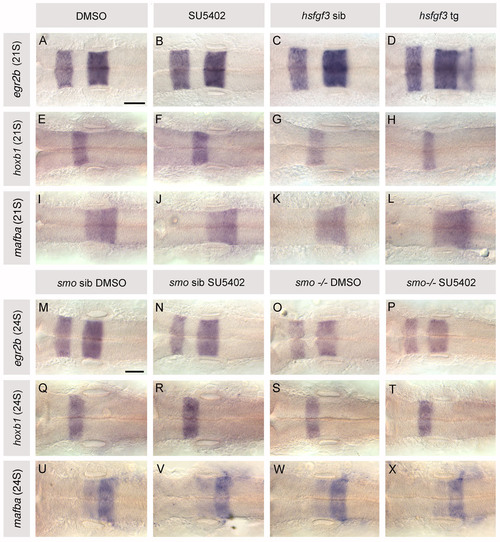
Expression of rhombomere-specific markers in the hindbrain of heat-shocked hsp70:fgf3, SU5402-treated wild-type and SU5402-treated smo-/- embryos. (A,B,E,F,I,J) 21S wild-type embryos treated with 10 μM SU5402/0.5% DMSO and control embryos treated with DMSO from 10 to 20S. (C,D,G,H,K,L) 21S hsp70:fgf3 transgenic (tg) and sibling (sib) embryos heat-shocked at 10S. (A-D) egr2b (krox20) expression, found in r3 and r5 in wild-type embryos, is normal in SU5402-treated embryos, but extends at a low level into r6 in hsp70:fgf3 transgenic embryos. (E-H) hoxb1 is expressed as normal in r4 of all embryos, although r4 appears reduced in hsp70:fgf3 transgenics. (I-L) val (mafba) expression, detected in r5 and r6 in wild-type embryos, is normal in SU5402-treated embryos but extends slightly into r6 in hsp70:fgf3 transgenic embryos. (M-X) 10 μM SU5402/0.5% DMSO-treated and control DMSO-treated smo-/- and sibling embryos at 24S, treated from 10 to 20S. Domains of egr2b (krox20), hoxb1 and val (mafba) expression are normal in smo-/-, SU5402-treated sibling and SU5402-treated smo-/- embryos. Dorsal views; anterior to left. Scale bars: 50 μm for all panels. |