
- Title
-
Hypoxia-induced retinal angiogenesis in zebrafish as a model to study retinopathy
- Authors
- Cao, R., Jensen, L.D., Söll, I., Hauptmann, G., and Cao, Y.
- Source
- Full text @ PLoS One
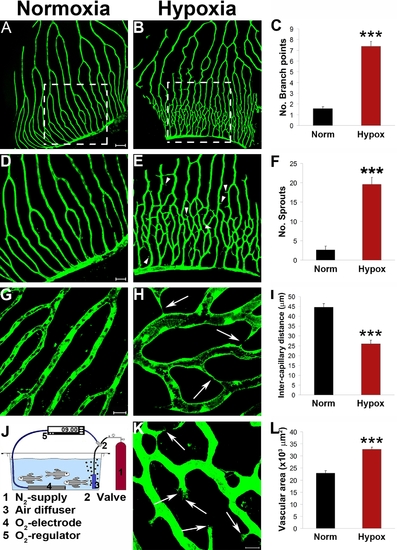
Hypoxia-induced retinal angiogenesis in adult fli-EGFP-Tg zebrafish. Adult fli-EGFP-Tg zebrafish were placed in a hypoxic aquaria and air saturation in the water was controlled at 10% (820 ppb) by an automated device (J). After 12-days exposure to this hypoxic environment, retinal angiogenesis in the capillary plexuses was detected (B, E, H, and K). Corresponding areas of the retinal vasculture exposed to normoxia were used as controls (A, D and G). Numbers of new vascular branches and sprouts, intercapillary distances, and total vascularization areas were accurately quantified (C, F, I, and L). Yellow arrowheads point to vascular sprouts. Yellow arrows point to endothelial tips. Data represents mean determinants of 11–16 randomized samples. ***p<0.001. Bar in panels A and B = 100 μm; in panels D and E = 50 μm; and in G and H = 20 μm. |
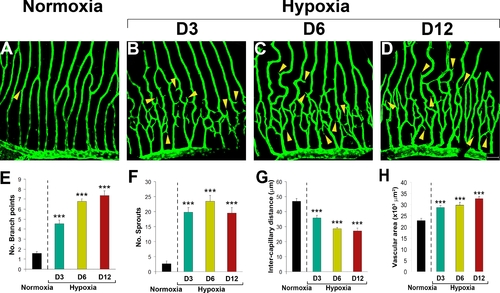
Time-course of hypoxia-induced retinal neovascularization. Hypoxia-induced retinal neovascularization in adult fli-EGFP-Tg zebrafish was kinetically monitored (A–H). Angiogenic sprouts were readily formed at day 2 and became overwhelmingly pronounced at day 3 (B) after exposure to hypoxia. The hypoxia-induced retinal angiogenic vessels continued to grow between days 3–12 (B–D). A maximal angiogenic response was detected at day 12. Quantification of new vessel branches (E), sprouts (F) intercapillary distances (G), and total vascularization areas (H) showed significant differences at all time points. Yellow arrowheads point to vascular sprouts. Data represents mean determinants of 11–16 randomized samples. ***p<0.001. Bar = 50 μm. |

Dose-dependent hypoxia-induced retinal neovascularization. Adult fli-EGFP-Tg zebrafish were exposed to 20% or 10% air-saturated water for 6 days. Retinal neovascularization was analyzed using whole-mount confocal analysis and quantified as branching points, numbers of sprouts, intercapillary distances, and total vascularization areas (A–J). Yellow arrowheads point to vascular sprouts. Data represents mean determinants of 11–25 randomized samples. *p<0.05. ***p<0.001. Bar = 50 μm |
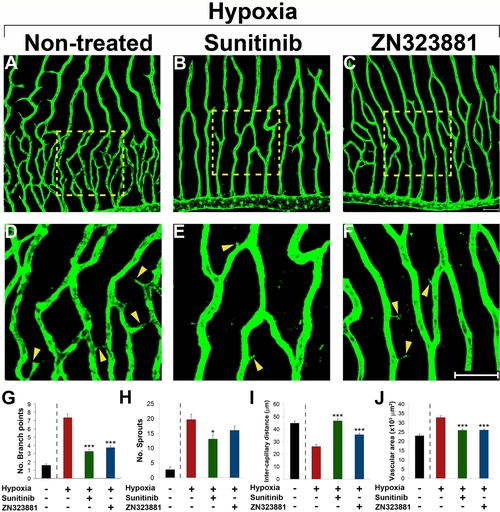
Inhibition of retinal neovascularization by orally active anti-VEGF drugs. Adult fli-EGFP-Tg zebrafish were exposed to 10 % hypoxia in the absence (A) or presence of sunitinib (B and E) or ZN323881 (C and F) anti-VEGF small molecules for 14 days. Retinal neovascularization was analyzed using whole-mount confocal analysis and quantified as branching points (G), numbers of sprouts (H), intercapillary distances (I), and total vascularization area (J). Yellow arrowheads point to vascular sprouts. Data represents mean determinants of 11–29 randomized samples. *p<0.05. ***p<0.001. Bar = 50 μm. |
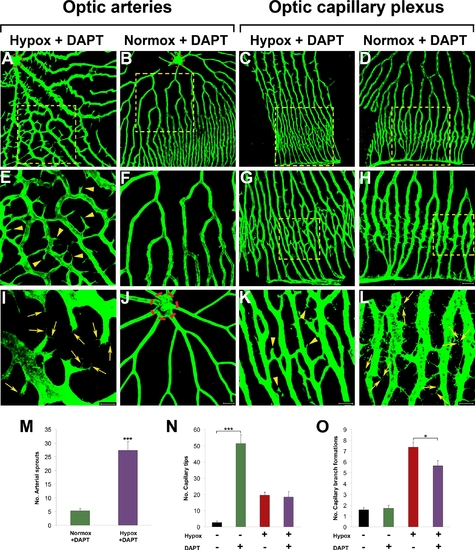
Inhibition of Notch under hypoxia and normoxia. Adult fli-EGFP-Tg zebrafish were exposed to 10 μM DAPT under hypoxia for 5 days (A, E, I, C, G, and K) or under normoxia for 6 days (B, D, F, H, and L). Control optic arteries without exposure to hypoxia or DAPT are shown in (J). E–H are amplified images of the inserts of A–D. Retinal neovascularization was analyzed using whole-mount confocal analysis and quantified as numbers of arterial sprouts (M), capillary tips (N) or branch formations (O).Yellow arrowheads point to vascular sprouts. Yellow arrows point to endothelial tips. The dashed red lines encircle the central optic artery. Data represent mean determinants of 11–13 randomized samples. *p<0.05. ***p<0.001. Bars in A–D = 100 μm; Bars in A–D = 50 μm; and Bars in A–D = 20 μm. |
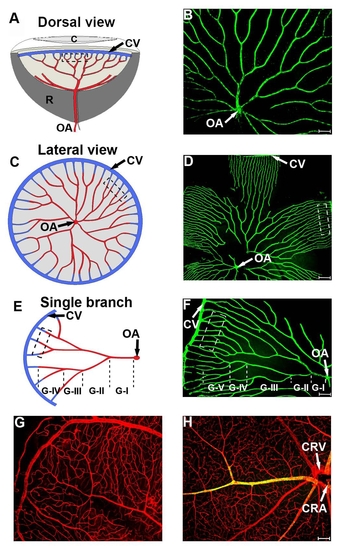
Comparison of the retinal vasculature in zebrafish and mice. Dorsal (a) and lateral views (c and e) of the retinal vasculature in zebrafish. The architecture and patterning of the retinal vasculature are highly organized with the optic artery (OA) located in the center of the optic disc (a-f, OA). Approximately 4-9 branches (Grade I) are derived from the OA and they further divide 2-5 times (Grade II-V) before the formation of capillary plexuses, which anastomose with vein capillaries that are collected in the circumferential vein (a-f, CV). The mouse retinal vasculature contains high density large and microvascular networks derived from the central retinal artery (CRA) and central retinal vein (CRV) (g and h). Red=CD31 positive signal; green=α-SMA positive signal; and yellow=double positive signal. |