
|
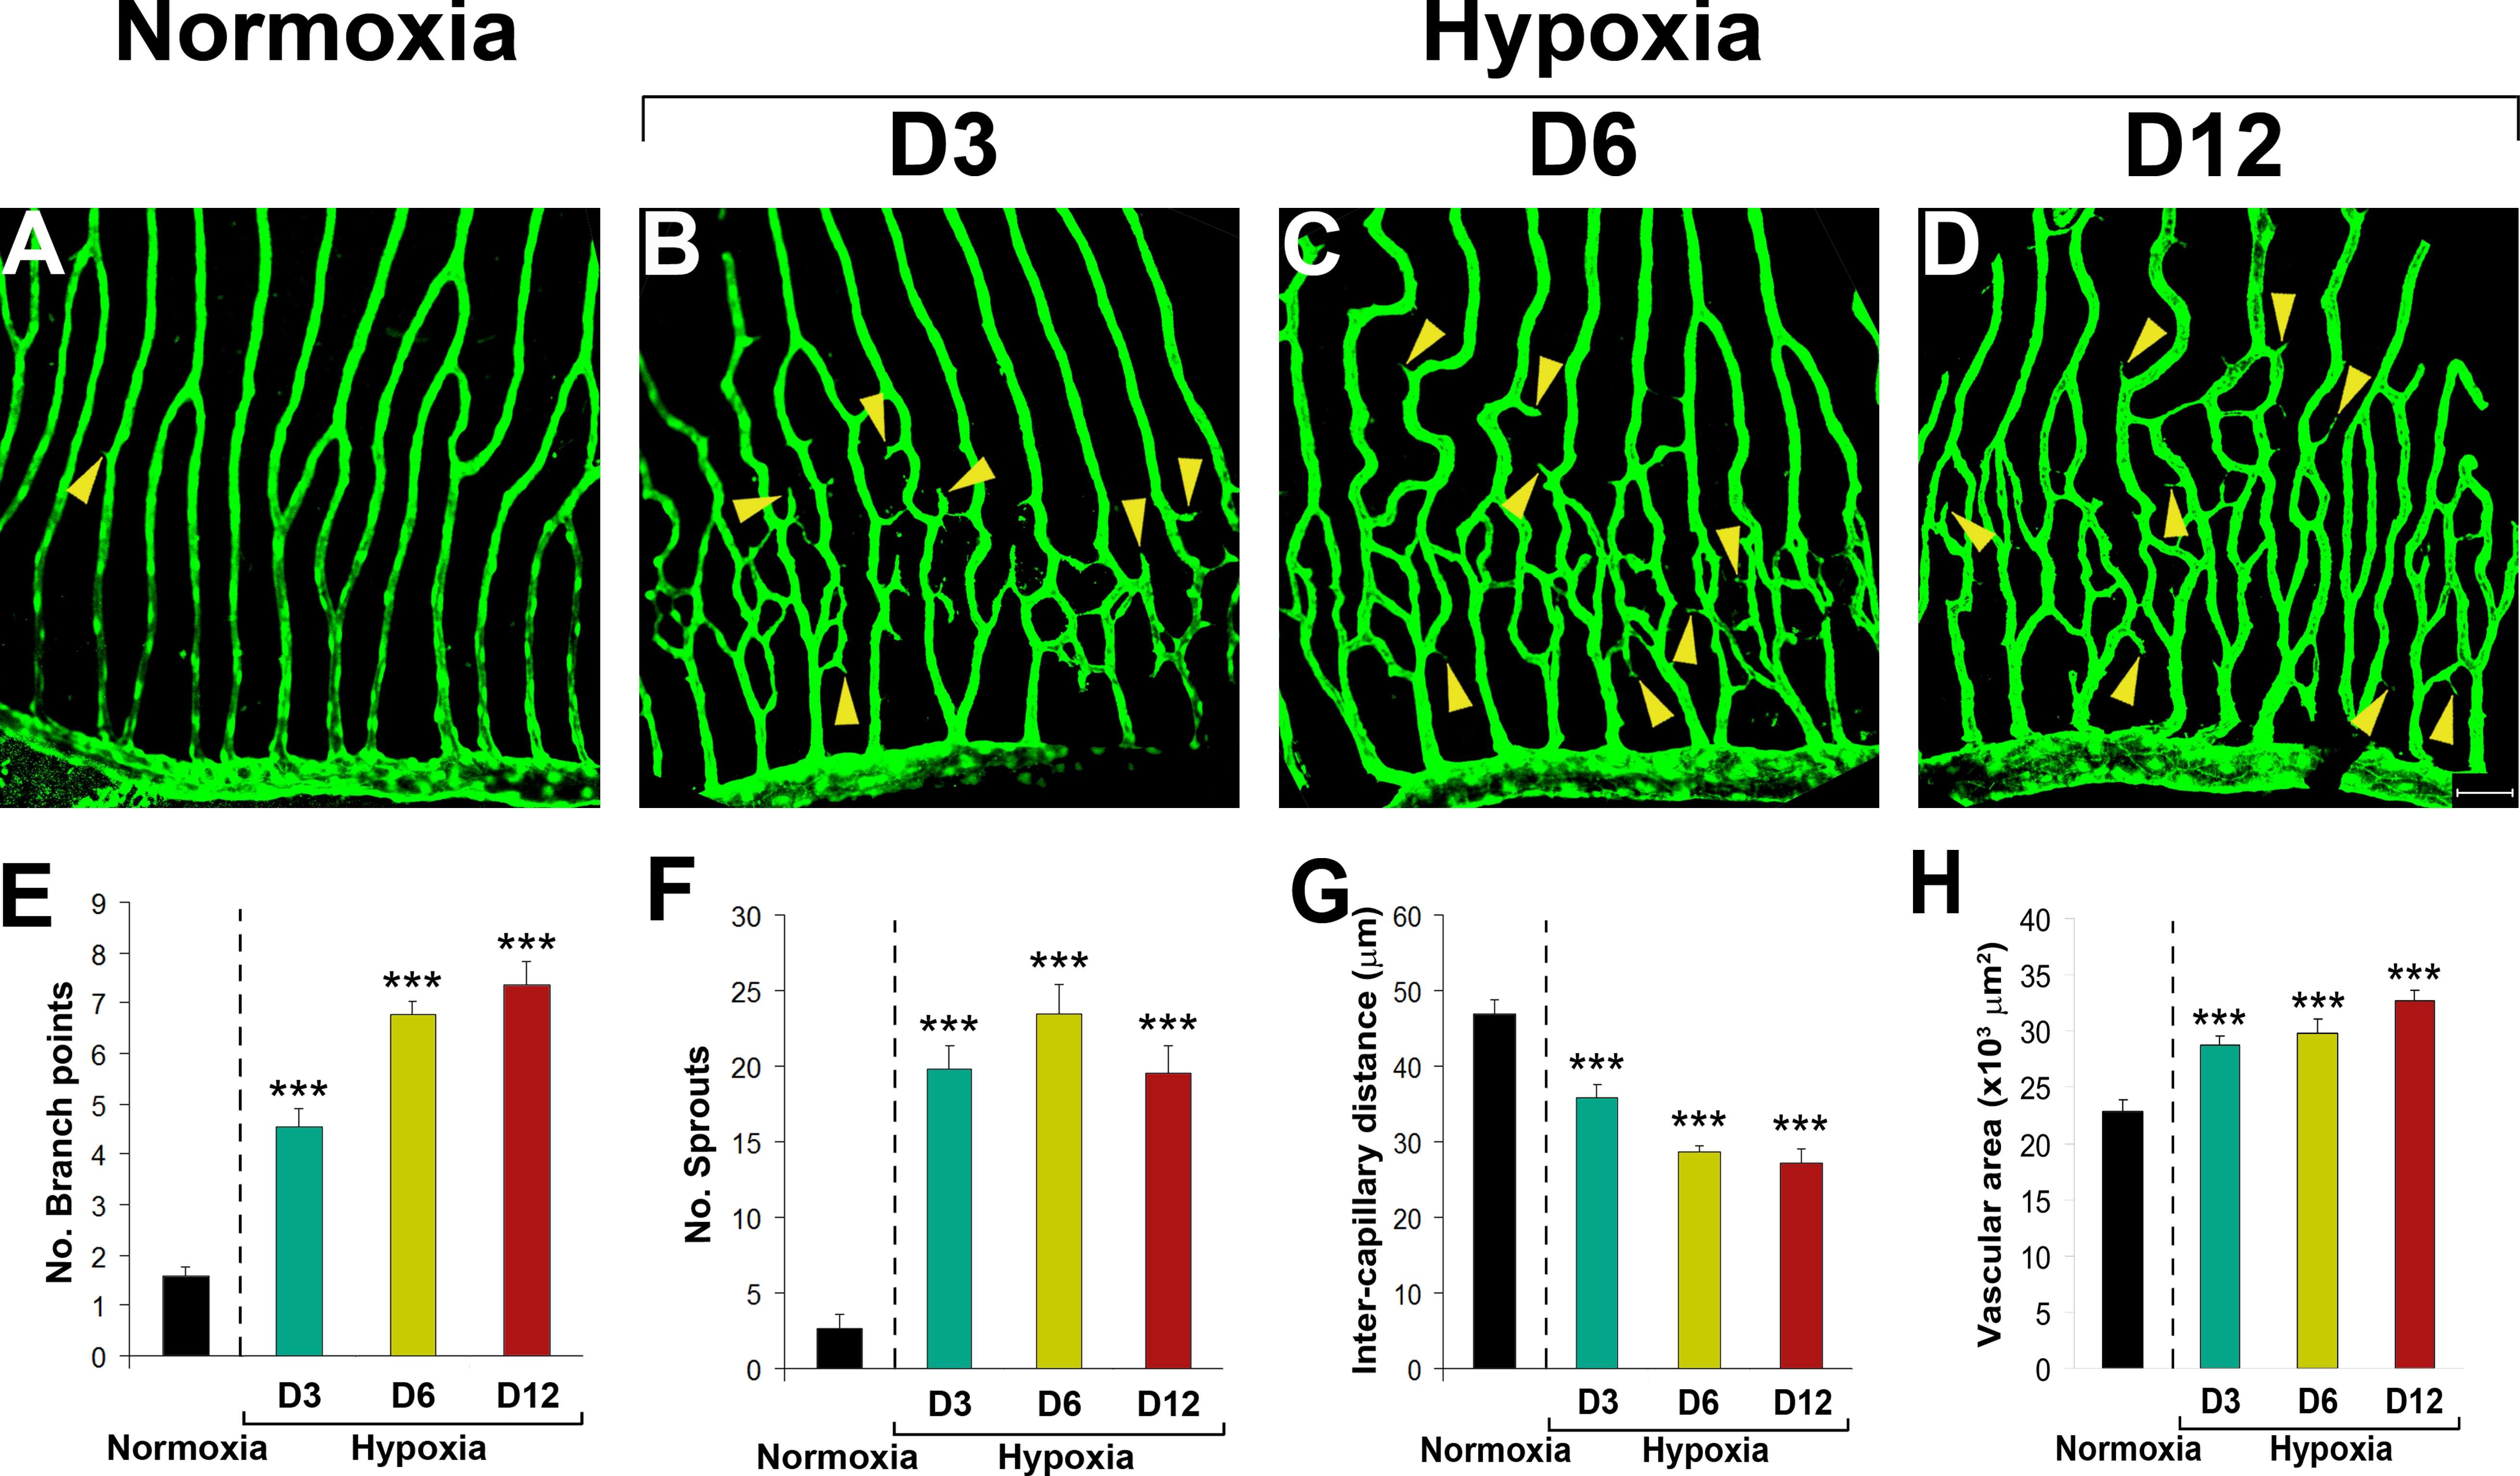
Fig. 2 Time-course of hypoxia-induced retinal neovascularization.
Hypoxia-induced retinal neovascularization in adult fli-EGFP-Tg zebrafish was kinetically monitored (A–H). Angiogenic sprouts were readily formed at day 2 and became overwhelmingly pronounced at day 3 (B) after exposure to hypoxia. The hypoxia-induced retinal angiogenic vessels continued to grow between days 3–12 (B–D). A maximal angiogenic response was detected at day 12. Quantification of new vessel branches (E), sprouts (F) intercapillary distances (G), and total vascularization areas (H) showed significant differences at all time points. Yellow arrowheads point to vascular sprouts. Data represents mean determinants of 11–16 randomized samples. ***p<0.001. Bar = 50 μm.