
|
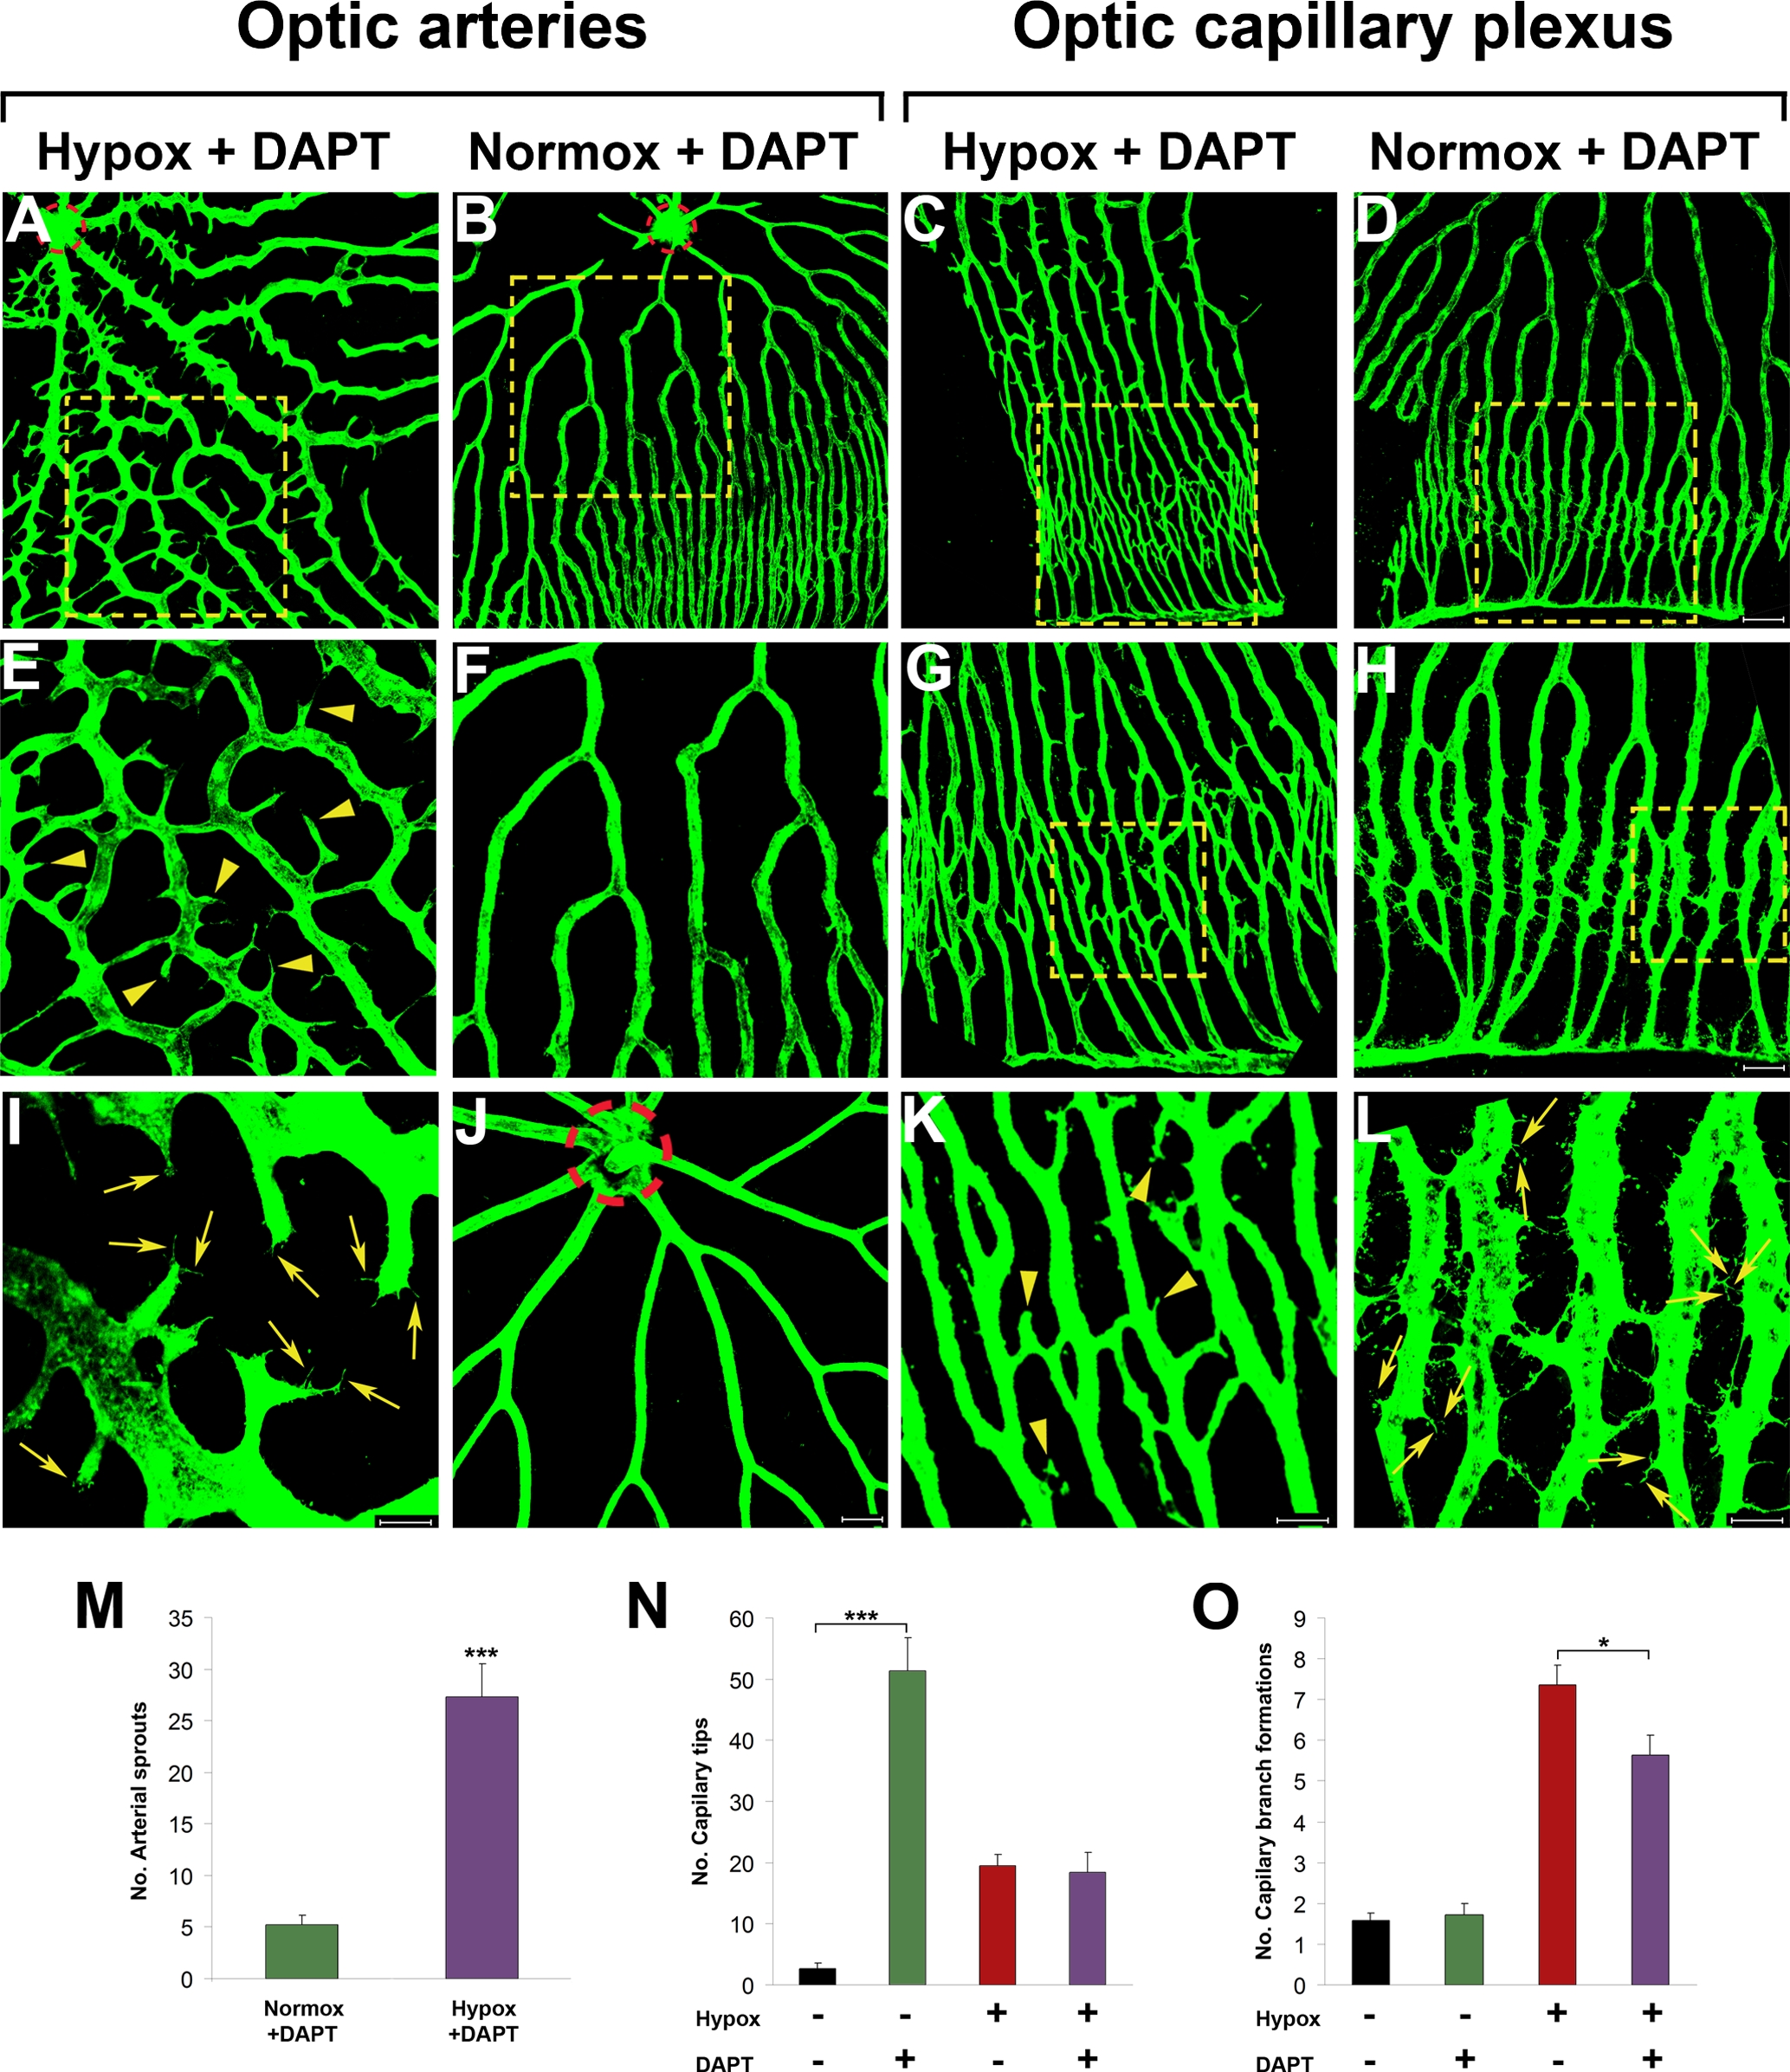
Fig. 5 Inhibition of Notch under hypoxia and normoxia.
Adult fli-EGFP-Tg zebrafish were exposed to 10 μM DAPT under hypoxia for 5 days (A, E, I, C, G, and K) or under normoxia for 6 days (B, D, F, H, and L). Control optic arteries without exposure to hypoxia or DAPT are shown in (J). E–H are amplified images of the inserts of A–D. Retinal neovascularization was analyzed using whole-mount confocal analysis and quantified as numbers of arterial sprouts (M), capillary tips (N) or branch formations (O).Yellow arrowheads point to vascular sprouts. Yellow arrows point to endothelial tips. The dashed red lines encircle the central optic artery. Data represent mean determinants of 11–13 randomized samples. *p<0.05. ***p<0.001. Bars in A–D = 100 μm; Bars in A–D = 50 μm; and Bars in A–D = 20 μm.