
- Title
-
Early, H+-V-ATPase-dependent proton flux is necessary for consistent left-right patterning of non-mammalian vertebrates
- Authors
- Adams, D.S., Robinson, K.R., Fukumoto, T., Yuan, S., Albertson, R.C., Yelick, P., Kuo, L., McSweeney, M., and Levin, M.
- Source
- Full text @ Development
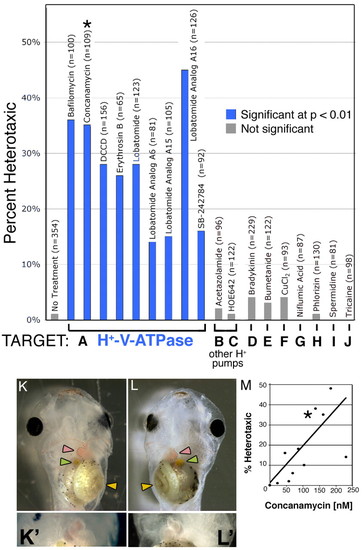
Heterotaxia induced by H+-V-ATPase inhibitors. Xenopus embryos were soaked in inhibitors of various ion transporters. The percent of embryos considered heterotaxic (defined as a reversal of at least one from the heart, gut or gall bladder) is calculated relative to the total number of embryos, most of which showed normal laterality. Inhibitors of H+-V-ATPase (A) caused significant levels of heterotaxia, while inhibitors of other proton pumps (B,C) or of other transporters (D-J) had no effect on laterality. Inhibitor names and sample sizes are listed above the bars; targets and doses of drugs in B-J are listed in Table 1. Complete randomization of three organs would lead to a maximum heterotaxia rate of 87.5%, as, by chance, organ situs will appear to be wild type in 12.5% of embryos. (K) A wild-type embryo, ventral view, showing the normal arrangement of the gut (yellow arrowhead), heart apex (pink arrowhead) and gall bladder (green arrowhead). (K') Higher magnification of normal heart. (L) A heterotaxic embryo (ventral view) showing reversal of all three organs, i.e. situs inversus. (L') Close-up of reversed heart. Image contrast has been enhanced for clarity, and the loop of the heart has been outlined with black dots in K and L. Drugs used for this screen were titered to determine a dose that will cause heterotaxia without causing other morphological defects; (M) an example titration curve for concanamycin. The asterisk in M corresponds to the datum used in A (115 nM). There is a degree of variability among sensitivity of embryos obtained from different females; toxicity (defined as the percent of embryos dying post-gastrulation and/or developing with significant morphological defects) increases at larger concentrations, and there is only a narrow range of useful doses. The dose that is toxic to 50% of embryos (TD50; corrected for control background lethality of 9%) was 234 nM. |

In situ hybridization for XNr1 in untreated and concanamycin-treated Xenopus embryos. Treatment of Xenopus embryos with the H+-V-ATPase inhibitor concanamycin causes significant levels of heterotaxia that can be seen in the situs of organs at stage 45 (Fig. 1L), but disruptions of laterality can be detected much earlier by the expression patterns of normally left-sided markers. (A-D) Sectioned embryos processed for in situ hybridization with an XNr1 antisense probe. In wild-type embryos, XNr1 is restricted to the left (A); however, in inhibitor-treated embryos, its expression is randomized (B-D). Green arrows indicate normal position of staining; red arrows indicate ectopic expression domain; white arrows indicate lack of expression in normal region. Dorsal is upwards in all panels; left and right sides correspond to those of the reader. |

Immunohistochemistry of H+-V-ATPase subunit A. Immunohistochemistry with an alkaline phosphatase conjugated secondary antibody for subunit A of the +-V-ATPase. Embryos were oriented based on pigmentation and cleavage patterns - a technique that consistently reveals biased asymmetry among the L and R blastomeres with respect to a number of properties (Fukumoto et al., 2005b). Positive signals are blue to purple; LR orientation of embryos is only possible in four- and eight-cell embryos. (A) The molecular motor (Gross et al., 2002) myosin V (AV section i.e. parallel to AV axis) and (B) the ciliary protein (Bonnafe et al., 2004) RFX3 (flat section, i.e. perpendicular to the AV axis) are examples of symmetrically distributed proteins. (C) Western blot showing that the antibody detects a single band of approximately the right size (predicted: 69 kDa) for subunit A. Green and white arrows indicate positive and a lack of signal, respectively. (D-H) Immunostaining for subunit A. (D) Two-cell embryo, AV section, showing one common staining pattern: `fingers' reaching animal-ward from the pool in the vegetal cytoplasm. Although this pattern is not exclusive to H+-V-ATPase subunits (Qiu et al., 2005), it is not found for many proteins (e.g. compare with A). (E) Flat section of a two-cell embryo showing another common staining pattern in which one blastomere is more heavily stained than its contralateral counterpart. (F) The asymmetry in staining seen in the flat sections is still visible at the four-cell stage when it is right-sided. (G) A flat section through a latrunculin-treated (actin depolymerized) embryo fixed at the four-cell stage, showing disruption of the normal pattern and loss of asymmetry in subunit A staining (compare with F). (H) A flat section through a nocodazole-treated (microtubules depolymerized) embryo showing that localization of subunit A can appear relatively unchanged by depolymerization of microtubules (compare with F). |

DiBAC staining reveals the Vmem pattern of blastomere membranes under normal conditions and in H+-V-ATPase inhibitor. (A) Graph showing the difference in DiBAC intensity on the left versus the right ventral quadrants of the embryo. Positive values (yellow) indicate that the right side is hyperpolarized with respect to the left side; negative values indicate the inverse. At the 16-cell stage, the right side is hyperpolarized with respect to the left. (B-D) Example of DiBAC-stained 16-cell embryo; DiBAC4(3) intensity on the left was greater than on the right. Fluorescence intensity in C and D is pseudocolored; LUT shown below. (B) Alexa 647-10,000 Mr dextran (Molecular Probes) lineage labeled the right ventral quadrant. (C) Background-corrected maximum-projected series of confocal images of DiBAC fluorescence overlaid with lineage label to show location of left ventral (LV) and right ventral (RV) quadrants and the position of the ventral midline (between). (D) Regions of interest outlined in yellow. Mean pixel intensities in these two regions were used as measures of depolarization of cells on the two sides of the embryo. The difference between these two mean intensities was calculated to produce data in A. (E,F) DiBAC4(3) fluorescence from a four-cell embryo; (E) untreated and (F) treated with concanamycin. Consistent with the prediction that inhibiting the H+-V-ATPase will cause cells to depolarize (as H+ builds up inside the membrane), concanamycin causes an increase in DiBAC4(3) fluorescence intensity visible here as the larger area of red and the area of white to lavender. |
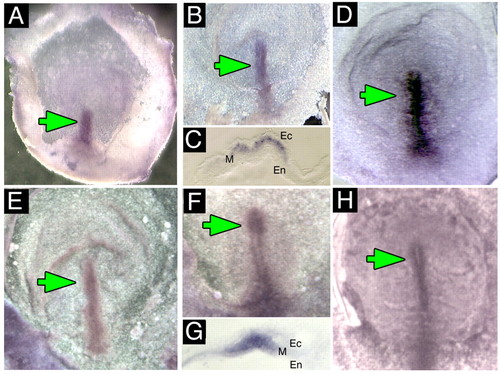
Expression of H+-V-ATPase subunits in early chick embryos. (A-D) Whole-mount in situ hybridization for H+-V-ATPase subunits; green arrows indicate normal location of staining. (A) Whole-mount in situ hybridization for subunit A in stage two chick embryos. Staining is in the primitive streak. (B) Whole-mount in situ hybridization for subunit A at stage 3 showing staining along the length and through to the tip of the primitive streak. (C) Section through the primitive streak of a stage 3 embryo reveals expression in the mesoderm. (D) Stage 4- embryo probed for subunit F, which, like subunits A and B, is found in the primitive streak, extending through Hensen's node. (E-H) Immunostaining for H+-V-ATPase subunits. (E) Stage 2+ chick embryo reveals subunit B along the length of the primitive streak. (F) In stage 3 chicks, staining for subunit B is in the streak and the node. (G) Cross-section through the streak of a stage 3 embryo showing subunit a staining in the mesoderm (M); Ec, ectoderm; En, endoderm. (H) Subunit B staining in a stage 4 chick. The streak and node are both positive. |
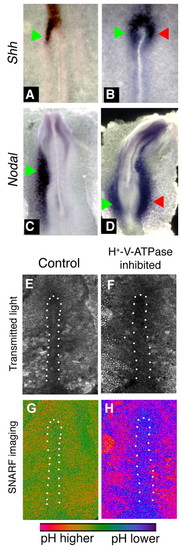
In situ hybridization for sonic hedgehog and Nodal, and pH imaging, in concanamycin-treated chick embryos. Embryos exposed to vehicle alone exhibited the normal left-sided expression of Shh (A) and Nodal (C). When exposed to the H+-V-ATPase inhibitor concanamycin during early streak stages, the left-sided expression becomes destabilized (see Table 4). Examples include bilateral expression of Shh (B) or Nodal (D). Culture of chick embryos can lead to bending of the AP axis such as that of embryo in D. In our experiments, about 15% of both control and treated embryos show this bend. Green arrows indicate normal position of staining; red arrows indicate ectopic expression domain. (E-H) Embryos treated with the pH indicator cSNARF-5F. Anterior is upwards and left is leftwards in all images. White dots indicate the approximate boundaries of the primitive streak. (E,F) Transmitted light images of two embryos. (G) Pseudocolored image of ratiometric data representing pH, shown in control embryo E. In most images, pH of the primitive streak is somewhat lower than pH of the surrounding area pellucida (AP) cells; the degree of contrast varies and is somewhat low in the image shown. (H) In concanamycin-treated embryos, the primitive streak cells (which stain positively for H+-V-ATPase subunits; see Fig. 5E-H) are at a lower pH than control cells (purple compared to green; embryo F). The AP, by contrast, is at a higher pH than controls. The difference between pH of the primitive streak and pH of the AP is much more pronounced in concanamycin-treated embryos. |
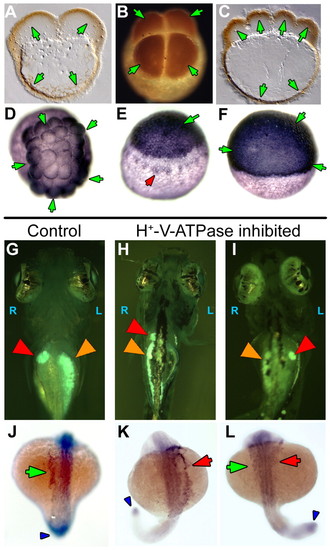
H+-V-ATPase subunits and heterotaxia in zebrafish. (A-F) Immunohistochemistry for H+-V-ATPase subunits in zebrafish embryos: (A) subunit F in a two-cell embryo; (B) subunit c in a four-cell embryo; (C) subunit F in an eight-cell embryo. Brown (HRP-conjugated secondary) indicates a positive signal. At these stages, the cortical cytoplasm of all cells is positive for these two subunits, as is the cortical cytoplasm of the yolk cell. (D) Thirty-two-cell zebrafish embryo stained for subunit c. Staining (blue, AP-conjugated secondary) is heaviest in the marginal cells of this stage, but present in all cells. (E) Early in epiboly, subunit c staining is dark in the cells of the spreading blastoderm. In addition, staining is visible around a ring of yolk syncitial nuclei, probably representing vesicle staining (red arrowhead). (F) Once epiboly is more than 50% complete, immunohistochemistry for subunit c shows an even and heavy distribution in all the cells of the blastoderm. The antibodies used in this figure did not work in western blots on chick and fish extracts. (G-I) Heterotaxia in zebrafish larvae. Tricaine-anaesthetized 5- to 6-day larvae were examined on a Zeiss StemiSV11 dissecting microscope under 488/40 nm illumination, using a 510 nm barrier filter. An embryo was considered heterotaxic if either pancreas (orange arrowheads), gall bladder (red arrowheads) or both organs were on the side opposite normal. (G) Normal position of gall bladder (right) and pancreas (left). (H) Heterotaxia involving the pancreas. (I) Heterotaxia involving both organs. When scoring two organs, the top heterotaxia rate is 75% as, by chance, organ situs will appear to be wild type in 25% of fully randomized embryos. (J-L) Whole-mount in situ hybridization for the nodal-related gene southpaw (Spaw), which is expressed in the left lateral plate mesoderm (LPM) and tailbud of wild-type embryos from approximately 15-somite to 22-somite stage. (J) Untreated embryos at 20-22-somite stages showed wild-type Spaw expression in the left LPM (green arrow). Spaw expression in the tail bud (an internal positive control for the specificity of the treatment on Spaw asymmetry) is indicated by a blue arrowhead. Similarly staged embryos treated early with the H+-V-ATPase inhibitor lobatomide A16 exhibited reversed (K, red arrow) and bilateral (L, green and red arrows) Spaw expression (Long et al., 2003). See Table 5 for statistical analysis. EXPRESSION / LABELING:
|
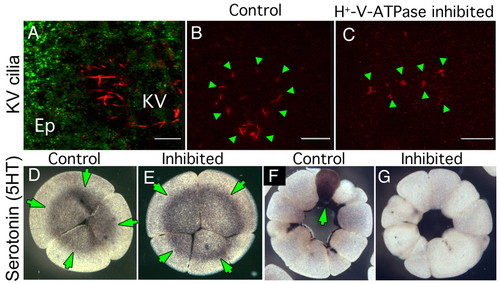
Effect of early H+-V-ATPase inhibition on Kupffer's vesicle cilia and localization of serotonin. (A) Oblique confocal section through an 8-somite zebrafish larva doubly immunostained for H+-V-ATPase subunit A (green) and acetylated tubulin (red). Although subunit A is obvious in cells of the overlying epithelium (Ep), no H+-V-ATPase subunits are associated with KV cilia. (B,C) IHC for acetylated tubulin reveals the structure of KV cilia (green arrowheads) in five- to seven-somite stage zebrafish embryos. (B) Untreated embryo showing the characteristic circular field of long straight cilia, (C) KV cilia of five- to seven-somite embryos, soaked in H+-V-ATPase inhibitors from the one-cell to shield stage, are often reduced in number, altered in distribution or appear foreshortened relative to controls. (D,E) Immunohistochemistry for serotonin (5-HT, green arrows) in four-cell Xenopus embryos using an antibody previously shown to be specific for 5-HT (Levin, 2004); (D) untreated, (E) incubated in concanamycin from the one-cell stage. At this stage, there is no effect of H+-V-ATPase inhibition on 5HT localization (green arrows) or level. F,G) Immunohistochemistry for 5HT in 32-cell Xenopus embryos; (F) normal pattern of 5HT staining in one cell in an untreated embryo (green arrows); (G) 5HT is absent from the H+-V-ATPase inhibited embryo. |
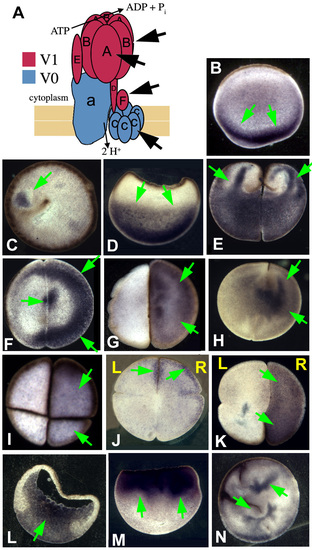
Immunohistochemistry for H+-V-ATPase subunits in early Xenopus embryos. Cartoon showing the arrangement of subunits in the H+-V-ATPase (after Nishi 2002). (B) Subunit A in an AV section (parallel to the animal-vegetal axis) of an unfertilized egg; subunits are found localized in the vegetal cortex. (C) A just-fertilized egg stained with anti-subunit F. A small area of staining can be seen next to the brown curve of pigment granules marking the path of sperm entry. (D) In post-rotation zygotes, staining for subunit A has moved up into the vegetal cytoplasm (AV section). (E-H) Two-celled embryos stained for subunits F and A. E illustrates a commonly seen pattern: subunit F staining appears to form fingers that reach up from the vegetal to the animal cytoplasm. In flat sections (perpendicular to the AV axis), staining is usually asymmetric and heavy near the cell membrane: (F) subunit F; (G) subunit A; (H) subunit A revealed with a different primary antibody. (I) Four-cell embryos, flat sections: (I) subunit A; (J) oriented section, subunit B. Staining is on the right hand side. (K) Flat section, oriented eight-cell embryo stained for subunit B. Staining is on the right hand side. (L) AV section through gastrula-stage embryo stained for subunit A. By this stage, staining is mostly uniformly distributed with respect to the LR axis. (M) Embryo treated with cytochalasin B to disrupt actin filaments, fixed when controls reached the two cell stage (no cleavage furrows form in actin-disrupted embryos). Staining for subunit B shows that the normal vegetal-plus-fingers localization of H+-V-ATPase subunits (compare to E) has become entirely animal. (N) Embryo treated with latrunculin to disrupt actin filaments, imaged when controls reached the four-cell stage. Subunit A staining reveals that localization has been completely disrupted (compare with I or J). Although the patterns presented in this figure match those found with the anti-subunit A (Fig. 3), the antibodies used for this figure, although highly specific in mammals, did not, in our hands, work for westerns. |

Unillustrated author statements EXPRESSION / LABELING:
|