
- Title
-
Syne2b/Nesprin-2 Is Required for Actin Organization and Epithelial Integrity During Epiboly Movement in Zebrafish
- Authors
- Li, Y.L., Cheng, X.N., Lu, T., Shao, M., Shi, D.L.
- Source
- Full text @ Front Cell Dev Biol

ZFIN is incorporating published figure images and captions as part of an ongoing project. Figures from some publications have not yet been curated, or are not available for display because of copyright restrictions. |
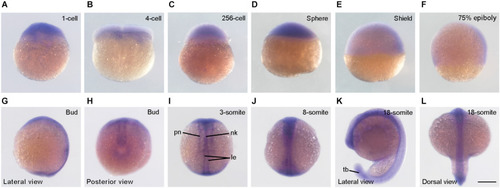
Expression pattern of EXPRESSION / LABELING:
|
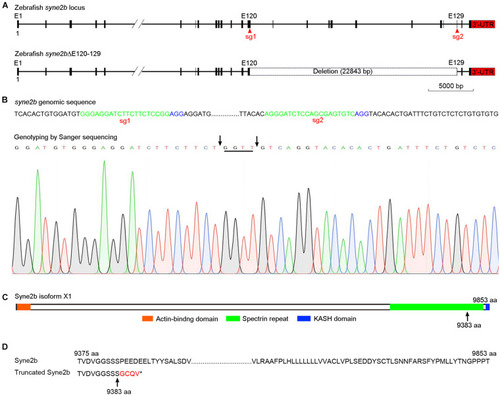
Generation of |
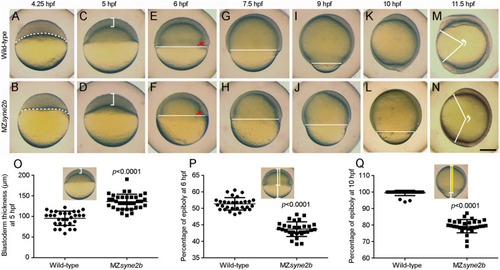
Disruption of Syne2b function impairs epiboly movement and anteroposterior axis elongation. Live images show epiboly initiation and progression in time-matched embryos. Lateral views with animal pole or anterior region on the top. PHENOTYPE:
|
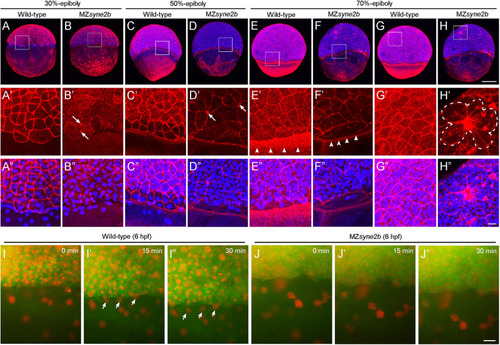
Disruption of Syne2b function affects F-actin organization, EVL cell shape and YSN movements. Phalloidin and DAPI staining of stage-matched embryos. PHENOTYPE:
|