IMAGE

FIGURE 3

ID
ZDB-IMAGE-210707-8
Source
Figures for Li et al., 2021
Image
Figure Caption

FIGURE 3

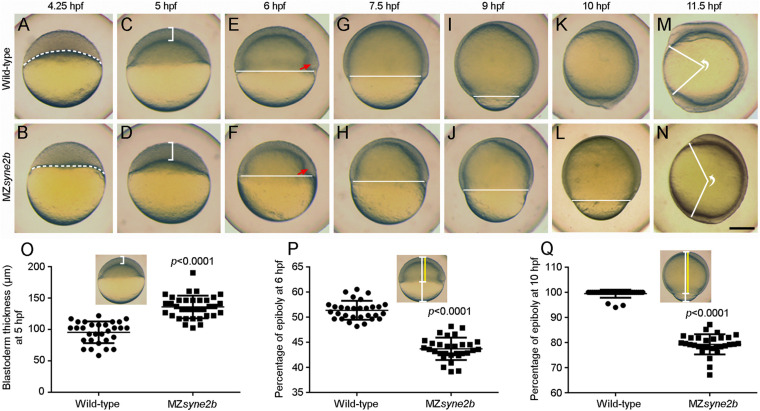
Disruption of Syne2b function impairs epiboly movement and anteroposterior axis elongation. Live images show epiboly initiation and progression in time-matched embryos. Lateral views with animal pole or anterior region on the top. (A,B) At 4.25 hpf, yolk cell domes into the blastoderm in wild-type embryos, while the border between the blastoderm and the yolk cell (broken lines) remains flat in MZsyne2b embryos. (C,D) At 5 hpf, the blastoderm in MZsyne2b embryos is thicker compared with wild-type embryos (brackets). (E,F) At 6 hpf, MZsyne2b embryos show delayed epiboly compared with wild-type embryos (horizontal lines). Red arrows indicate the embryonic shield. (G–J) At 7.5 and 9 hpf, delayed epiboly progression is evident in MZsyne2b embryos. (K,L) At 10 hpf, wild-type embryos complete gastrulation, whereas MZsyne2b embryos only reach about 80% epiboly. (M,N) At 11.5 hpf, wild-type embryos develop a long anteroposterior axis, while MZsyne2b embryos only complete gastrulation. The angle formed between the most anterior end and the most posterior end of the anteroposterior axis, with vertex at the geometric center of the embryo, reflects the extent of axis elongation. (O) Scatter plot compares blastoderm thickness between wild-type and MZsyne2b embryos. (P,Q) Scatter plots compare epiboly progression between wild-type and MZsyne2b embryos. Scale bars: (A–N) 200 μm.

Figure Data
Acknowledgments
This image is the copyrighted work of the attributed author or publisher, and ZFIN has permission only to display this image to its users. Additional permissions should be obtained from the applicable author or publisher of the image. Full text @ Front Cell Dev Biol