
- Title
-
Developmentally regulated Tcf7l2 splice variants mediate transcriptional repressor functions during eye formation
- Authors
- Young, R.M., Ewan, K.B., Ferrer, V.P., Allende, M.L., Godovac-Zimmermann, J., Dale, T.C., Wilson, S.W.
- Source
- Full text @ Elife
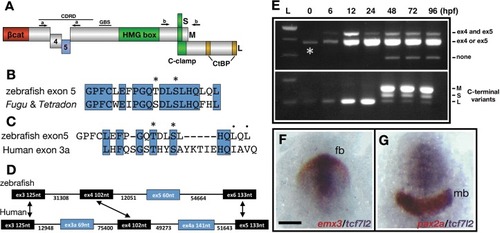
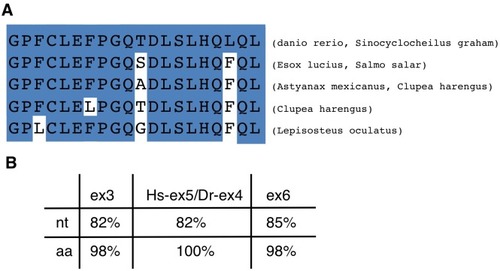
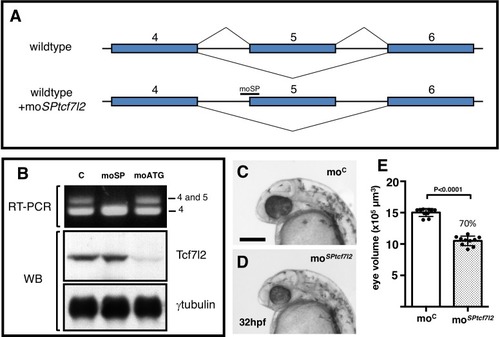
(A) Schematic representation of variants of Tcf7l2 arising from different splice forms (not to scale). Labels 4 and 5 represent the region of Tcf7l2 coded by alternative exons 4 and 5. Short (S) Medium (M) and Long (L) C-terminal variants coded by alternative splice variants in the 5? end of exon 15 are indicated. Red box, ?-catenin (?cat) binding domain. Green boxes, High-Mobility Group (HMG) Box, which is the primary DNA interacting domain, and C-clamp DNA-helper binding domain. Yellow boxes, CtBP interaction domains. CDRD labelled line over exons 4 and 5 indicates the Context Dependent Regulatory Domain and Groucho Binding Site (GBS) marks the region of interaction with Groucho/Tle transcriptional co-repressors. Arrows indicate the position of primer sets ?a? and ?b? used for RT-PCR experiments in (E). (B?C) Alignment of the amino acid sequences coded by zebrafish, Takifugu rubripens and Tetradon tcf7l2 exon 5 (B) or human exon 3a (C). Identical amino acids marked by blue boxes. Asterisks over sequence mark putative phosphorylated amino acids. Dots over sequence indicate similar amino acids. (D) Schematic of the genomic region of zebrafish and human tcf7l2. Introns depicted as lines and exons as boxes. Blue exon boxes depict human tcf7l2 alternative exons 3a and 4a, and zebrafish alternative exon 5. Black exon boxes indicate equivalent exons in both species emphasised by arrows. Numbers under introns and within exons represent their nucleotide size (not to scale). (E) RT-PCR experiments performed on cDNA from embryos at stages indicated in hours post fertilisation (hpf). L, 1 Kb ladder. Top panel shows results of PCRs using primer set ?a? (indicated in Figure 1A, Materials and methods) amplifying the region of alternative exons 4 and 5. Middle band contains amplicons including either tcf7l2 exon 4 or exon 5. Bottom panel shows results of PCRs using primer set ?b? (indicated in Figure 1A, Materials and methods) amplifying the region of alternative exon 15. Asterisk shows maternal expression of tcf7l2. (F?G) Double in situ hybridisation of tcf7l2, in blue, and emx3 (F) or pax2a (G) in red. 10hpf flat mounted embryos, dorsal view, anterior up, posterior down; fb, prospective forebrain; mb, prospective midbrain. Scale Bar in (F) is 200 �m EXPRESSION / LABELING:
|
( |
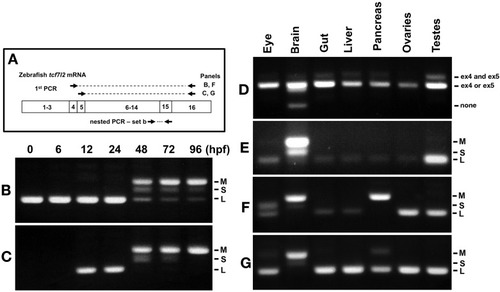
RT-PCR analysis of alternative exons 4, 5 and 15 of zebrafish |
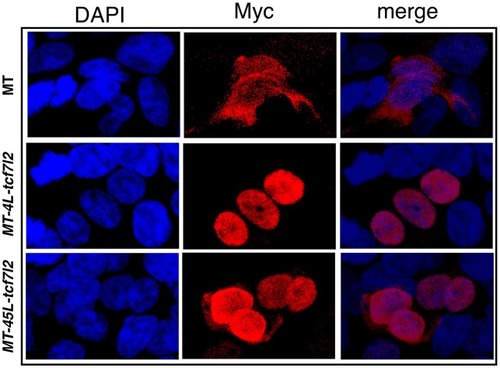
Sub-cellular localisation of 4L-Tcf7l2 and 45L-Tcf7l2 myc tagged splice variants. HEK293 cells were transfected with empty myc tag (MT) vector (top row), |
( PHENOTYPE:
|
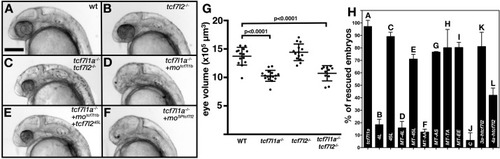
(A?F) Lateral views (anterior to left, dorsal up) of 28hpf live wildtype (A), tcf7l2 zf55/ zf55 (B), double tcf7l1a-/-/tcf7l2 zf55/ zf55 (C) and tcf7l1a-/- (D?F) zebrafish embryos with injected reagents indicated top right showing representative phenotypes. (D) 0.12 pmol motcf7l1b (E), 0.12 pmol motcf7l1b and 20 pg of 45L-tcf72 splice variant mRNA, (F) 1.25 pmol moSPtcf7l2. Scale bar in (A) is 200 �m. (G) Plot showing the volume of eyes (�m3) of 30hpf fixed embryos coming from a double heterozygous tcf7l1a/tcf7l2 mutant incross. Error bars are mean � SD, only P values greater than 0.1 from unpaired t test with Welch's correction are indicated. Data in Supplementary file 1C. (H) Bars represent the percentage of tcf7l1a-/- embryos that develop eyes (with distinguishable lens and pigmented retina) coming from multiple tcf7l1a+/- female to tcf7l1a-/- males crosses, injected with 0.12 pmol of motcf7l1b (all bars) and co-injected with constructs stated on X axis: 10 pg of tcf7l1a mRNA (A) 20 pg of tcf7l2 mRNA splice variants 4L-tcf7l2 (B) 45L-tcf7l2, (C) MT-4L-tcf7l2 (D) MT-45L-tcf7l2 (E) MT-tcf7l2-AA (F) MT-tcf7l2-AS (G) MT-tcf7l2-TA (H) MT-tcf7l2-AA (I) htcf7l2-C (J) htcf7l2-3a (K) and htcf7l2-4a (L). Data for all these plots are included in Supplementary file 1E. Error bars are mean � SD |

Bar plots showing luciferase reporter assay results expressed in relative light units. HEK293 cells were transiently co-transfected with luciferase reporter constructs indicated beneath the X-axis, ( |
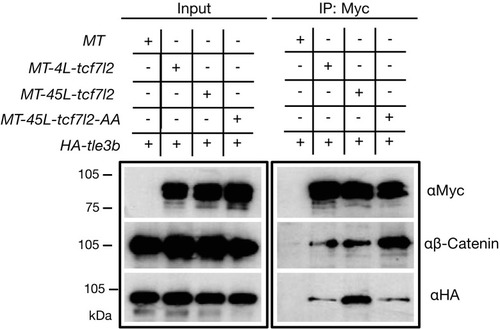
Protein input (left panel) and anti-Myc immunoprecipitation (IP) eluate western blot (right panel) showing co-inmunoprecipitation of ?-Catenin or HA-tagged Tle3b. HEK293 cells were transiently transfected with HA tagged tle3b together with empty myc tag vector (1st lane), MT-4L-tcf7l2 (2nd lane), MT-45-tcf7l2 (3rd lane) and MT-AA-tcf7l2 (4th lane). Left panels show protein input before anti-Myc IP. Right panels show protein eluate from anti-Myc antibody coupled beads. Westernblots were probed with anti-Myc (tagged Tcf7l2 proteins, top panel), anti-?catenin (middle panel) and anti-HA (tagged Tle3b protein, bottom panel) antibodies. Asterisk shows that the Tcf7l2 form containing exon five shows more intense binding with Tle3b than other Tcf7l2 forms. |
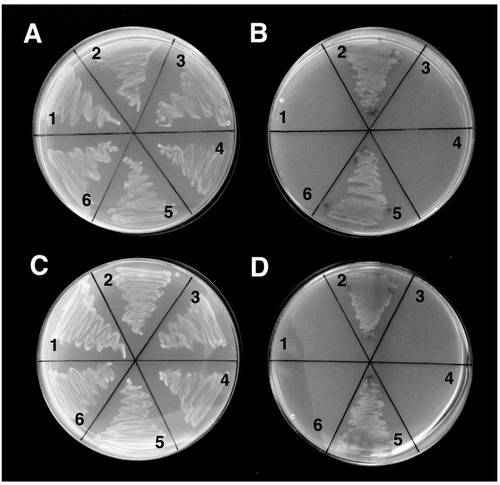
Y2Gold yeast strain was co-transformed with: (1) β-catenin/ |