
- Title
-
Expanding the CRISPR Toolbox with ErCas12a in Zebrafish and Human Cells
- Authors
- Wierson, W.A., Simone, B.W., WareJoncas, Z., Mann, C., Welker, J.M., Kar, B., Emch, M.J., Friedberg, I., Gendron, W.A.C., Barry, M.A., Clark, K.J., Dobbs, D.L., McGrail, M.A., Ekker, S.C., Essner, J.J.
- Source
- Full text @ CRISPR J

Characterization and activity of CRISPR-ErCas12a in zebrafish. |

Using |
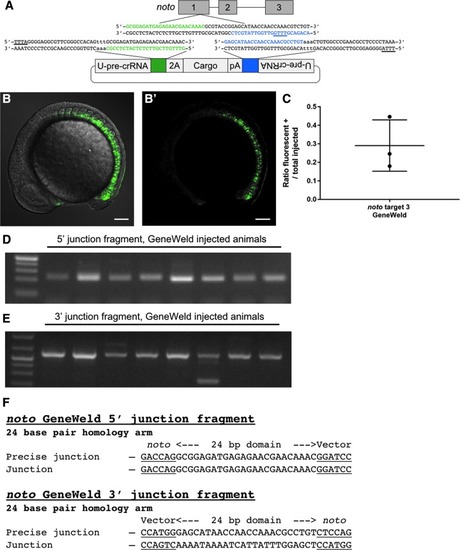
Targeting |
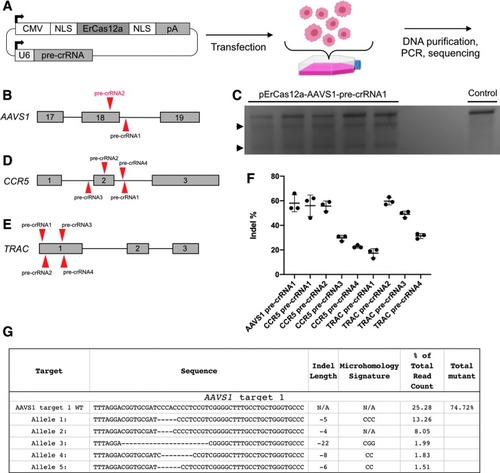
ErCas12a activity in human HEK293T cells. |
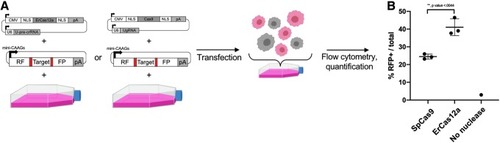
Using pMini-CAAGs::RFP-DR48 to assay the propensity of ErCas12a and SpCas9 to elicit strand annealing in HEK293T cells. |

Using ErCas12a for targeted integration in human cells. |