FIGURE

FIG. 3.

ID
ZDB-FIG-191230-1897
Publication
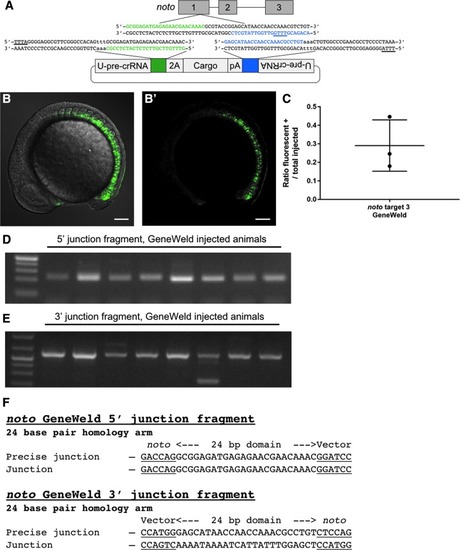
Wierson et al., 2019 - Expanding the CRISPR Toolbox with ErCas12a in Zebrafish and Human Cells
Other Figures
All Figure Page
Back to All Figure Page
FIG. 3.

Targeting noto with GeneWeld. (A) Schematic of noto showing designed homology for precise integration using ErCas12a and the U-pre-crRNA. Green is designed 5′ homology. Blue is designed 3′ homology. The PAM for ErCas12a targeting in the genome and donor is underlined. (B and B′) Confocal Z-stack image showing broad green fluorescent protein (GFP) expression in the embryo. Scale bar is 100 μm. (C) Data plot showing the ratio of embryos with GFP expression in the notochord out of total injected embryos. Data plot represents the mean ± SD. (D) Gel showing 5′ junction fragment expected after precise integration using GeneWeld. (E) Gel showing 3′ junction fragment expected after precise integration using GeneWeld. (F) DNA sequencing of lane 5 in (D) and (E) showing a precise integration using the programmed homology.

Expression Data

Expression Detail
Antibody Labeling
Phenotype Data

Phenotype Detail
Acknowledgments
This image is the copyrighted work of the attributed author or publisher, and ZFIN has permission only to display this image to its users. Additional permissions should be obtained from the applicable author or publisher of the image. Full text @ CRISPR J