IMAGE

FIG. 4.

ID
ZDB-IMAGE-191230-1887
Source
Figures for Wierson et al., 2019
Image
Figure Caption

FIG. 4.

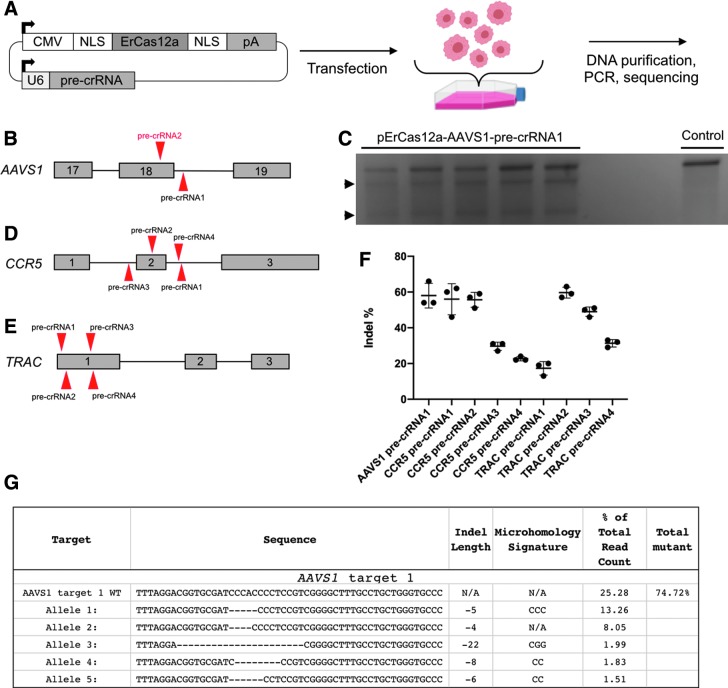
ErCas12a activity in human HEK293T cells. (A) Schematic showing the workflow for ErCas12a and pre-crRNA expression in human cells from a cis expression plasmid. After transfection, cells are recovered and then analyzed. (B) Schematic of two pre-crRNAs designed to target AAVS1. (C) T7E1 assay showing AAVS1-pre-crRNA1 is active. Arrowheads are cleaved bands, indicating nuclease activity. (D) Schematic of four pre-crRNAs designed to target CCR5. (E) Schematic of four pre-crRNAs designed to target TRAC. (F) Graph showing percentage of indels after using pre-crRNAs to target AAVS1, CCR5, and TRAC in HEK293T cells as determined by ICE analysis. Data plot represents the mean ± SD. (G) Results displaying the wild-type and top five mutated alleles after AmpliconEZ analysis of AAVS1 targeted DNA.

Acknowledgments
This image is the copyrighted work of the attributed author or publisher, and ZFIN has permission only to display this image to its users. Additional permissions should be obtained from the applicable author or publisher of the image. Full text @ CRISPR J