
- Title
-
The LipoGlo reporter system for sensitive and specific monitoring of atherogenic lipoproteins
- Authors
- Thierer, J.H., Ekker, S.C., Farber, S.A.
- Source
- Full text @ Nat. Commun.

ZFIN is incorporating published figure images and captions as part of an ongoing project. Figures from some publications have not yet been curated, or are not available for display because of copyright restrictions. |
|
ZFIN is incorporating published figure images and captions as part of an ongoing project. Figures from some publications have not yet been curated, or are not available for display because of copyright restrictions. |

Whole-mount imaging of apolipoprotein B-containing lipoprotein (ApoB-LP) localization using LipoGlo chemiluminescent microscopy. a Representative images of ApoB-LP localization patterns from analysis of 15 larvae per genotype from wild-type (WT), mtp−/−, and apoC2−/− genotypes (6 days post fertilization (dpf)). The white arrow and arrowhead mark the larval intestine and liver respectively. b LipoGlo signal colocalizes with the central nervous system marker Tg(Xla. Tubb2-mApple-CAAX), quantification in Supplementary Fig. 5. c LipoGlo signal localized to subregions of the central nervous system (CNS). d–f Representative images and g–i quantification of ApoB-LP localization across developmental, genetic, pharmacological, and dietary manipulations. g Signal localization at each day of larval development in WT (degree of freedom (DF) = 5, n = 15, Welch’s analysis of variance (ANOVA) p < 0.0001 for each region over time), mtp−/− (DF = 11, n = 15, two-way robust ANOVA p < 0.001 for all regions, Games–Howell p < 0.001), and apoC2−/− (DF = 11, n = 15, two-way robust ANOVA was not significant for any region) genetic backgrounds. Upward-facing arrowheads (green) indicate significant enrichment of that species at that time point compared to WT, and downward-facing arrowheads (magenta) indicate depletion using the Games–Howell test with a threshold of p < 0.05. h Signal localization from 3 to 5 dpf in larvae treated with 10 μM lomitapide or vehicle control (DF = 11, n = 15, two-way robust ANOVA p < 0.001 for head and viscera, Games–Howell p < 0.0001). i Subclass abundance from 10 to 15 dpf in larvae subjected to a fasting and re-feeding paradigm. The first bracket delineates changes relative to time 0 (the onset of the fasting period), and the second bracket delineates changes relative to time point 48 (the onset of the re-feeding period) (DF = 10, n = 15, Welch’s ANOVA p < 0.0001 for each region, Games–Howell p < 0.005). Supplementary Figure 4 displays standard deviations for g–i. Results represent pooled data from three independent experiments, “n” denotes number of samples per data point. Scale bars = 500 μm. |
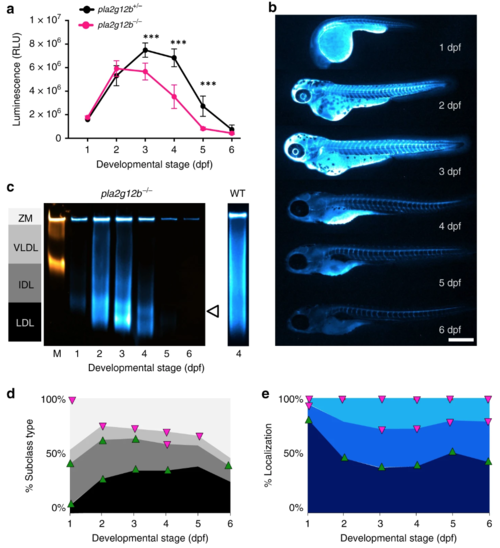
LipoGlo reveals profound alterations in the apolipoprotein B-containing lipoprotein (ApoB-LP) profile in pla2g12b−/− mutant larvae. a Comparison of LipoGlo signal between pla2g12b−/− and pla2g12b+/− siblings during larval development (1–6 days post fertilization (dpf)) (degrees of freedom (DF) = 11, n ≈ 11, two-way robust analysis of variance (ANOVA) p < 0.0001 for genotype and stage, Games–Howell p < 0.0001). b Representative images (n = 15) of ApoB-LP localization collected by LipoGlo chemiluminescent imaging throughout development (1–6 dpf), and e quantification of percent localization into previously described subregions (DF = 11, n = 15, two-way robust ANOVA p < 0.001 for all regions, Games–Howell p < 0.0001). cRepresentative gel (n = 4) showing production of abnormally small lipoproteins (white arrowhead) and d quantification of LipoGlo emission pattern from Native-polyacrylamide gel electrophoresis (Native-PAGE) samples in pla2g12b−/− larvae (1–6 dpf). Upward-facing arrowheads (green) indicate significant enrichment of that species at that time point compared to WT, and downward-facing arrowheads (magenta) indicate depletion using the Games–Howell test with a threshold of p < 0.05 (DF = 11, n = 9, two-way robust ANOVA p < 0.001 for all species, Games–Howell p < 0.01). Results represent pooled data from three independent experiments, “n” denotes number of samples per data point. *** denotes p < 0.0001. |
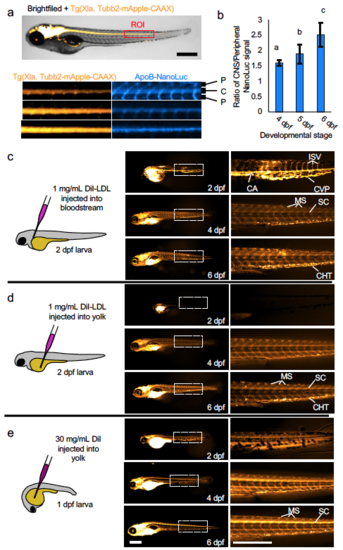
LipoGlo microscopy reveals ApoB-LP localization. (a) Three independent clutches of larvae carrying both the CNS marker Tg(Xla. Tubb2-mApple-CAAX) and ApoB-NanoLuc fusion were fixed and imaged at 4, 5, and 6 dpf as described in detailed methods. A 20x100 pixel region of interest (ROI) was drawn centered around the spinal cord (marked by mApple) just distal to the intestine. The mApple and ApoB-NanoLuc channels are displayed separately below (representative of 15 images per time point). (b) Quantification of the signal intensity in spinal cord (CNS) versus peripheral regions revealed a gradual enrichment of signal in the CNS relative to the periphery from 4-6 dpf (DF=2, n=15, Welch’s ANOVA p<0.0001, Games-Howell p<.01), mean ± SD shown. (c) Schematic and results of injection of DiI-labeled human LDL into the common cardinal vein of zebrafish larvae. Immediately following injection on 2 dpf, signal is primarily detectable in blood vessels such as the caudal artery (CA), caudal vein plexus (CVP), and intersegmental vessels (ISV). Later in development (4-6 dpf) signal is primarily localized to extravascular tissues such as the myosepta (MS), spinal cord (SC) and puncta in the caudal hematopoietic tissue (CHT) that likely correspond to macrophages (n=6). (d) When DiI-LDL is injected into the yolk, signal is undetectable in the vasculature of early-stage larvae, but in ~50% of cases (3 out of 6) will be detected in both vascular and extravascular tissues of later-stage larvae (n=6). (e) A solution of DiI injected into the larval yolk leads to a staining pattern that closely mirrors LipoGlo-microscopy experiments, indicating that it stains endogenous lipoproteins produced in the YSL (N=15). Results represent pooled data from three independent clutches, “n” denotes total number of samples per data point. Scale bars = 500 μm. Source data are provided as a Source Data file. |
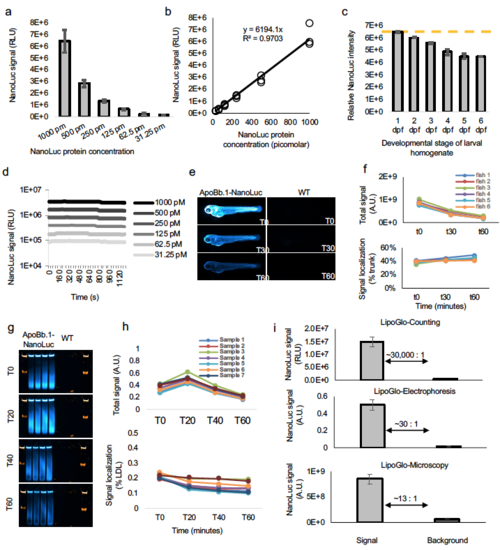
NanoLuc standard curves. (a) To determine the absolute concentration of ApoB-LPs in the larval homogenate, purified NanoLuc protein was ordered directly from Promega (Nluc-HT Protein, 500ug, 54.2KDa, #CS188401) and diluted to 1 nM working concentration in 1x ApoB-LP stabilization buffer. This solution was subjected to a 6-point series of 2-fold dilutions and used in a plate-based assay for NanoLuc activity (mean ± SD shown), and (b) showed the expected log-linear relationship. (c) There is a marked increase in pigmentation throughout larval development, causing homogenate to become progressively more opaque. To test the effect of pigment on NanoLuc readings, wild-type larvae that lack the ApoB-NanoLuc reporter were homogenized in ApoB-LP stabilization buffer at each stage of development. This homogenate was then supplemented with a final concentration of 1 nM NanoLuc protein and subjected to a plate read assay. As expected, the relative intensity of NanoLuc signal declines from 2 – 6 dpf, indicating that absolute quantitation of NanoLuc levels should include a standard curve that accounts for larval pigmentation (mean ± SD shown). (d) Analysis of LipoGlo counting signal over time (well values read every 40 seconds for 20 minutes) demonstrated that this assay is robust to slight fluctuations in incubation time, as signal half-lives were calculated to be greater than 60 minutes for all concentrations tested. (e) Analysis of LipoGlo microscopy signal over time revealed detectable signal well above background for over 60 minutes, and (f) although absolute signal declined over time (top panel), the signal localization remained relatively constant over short fluctuations in incubation time (bottom panel). (g) Analysis of LipoGlo electrophoresis signal over time (h) revealed that reads immediately after substrate addition (T0) were abnormally low (top panel) and biased toward detection of abundant lipoprotein species (bottom panel). However, following a brief incubation period (minimum of 5 minutes), absolute signal decays gradually over time, but changes in relative signal are much less pronounced (T20 – 60). (i) Quantification of the signal to background ratio of each of the LipoGlo assays, mean ± SD shown. Source data are provided as a Source Data file. |