
Fig. S5
- ID
- ZDB-FIG-190823-5
- Publication
- Thierer et al., 2019 - The LipoGlo reporter system for sensitive and specific monitoring of atherogenic lipoproteins
- Other Figures
- All Figure Page
- Back to All Figure Page
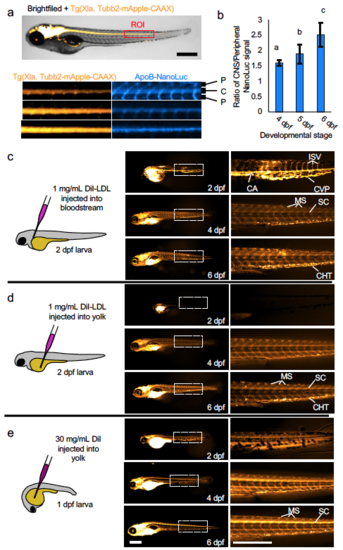
LipoGlo microscopy reveals ApoB-LP localization. (a) Three independent clutches of larvae carrying both the CNS marker Tg(Xla. Tubb2-mApple-CAAX) and ApoB-NanoLuc fusion were fixed and imaged at 4, 5, and 6 dpf as described in detailed methods. A 20x100 pixel region of interest (ROI) was drawn centered around the spinal cord (marked by mApple) just distal to the intestine. The mApple and ApoB-NanoLuc channels are displayed separately below (representative of 15 images per time point). (b) Quantification of the signal intensity in spinal cord (CNS) versus peripheral regions revealed a gradual enrichment of signal in the CNS relative to the periphery from 4-6 dpf (DF=2, n=15, Welch’s ANOVA p<0.0001, Games-Howell p<.01), mean ± SD shown. (c) Schematic and results of injection of DiI-labeled human LDL into the common cardinal vein of zebrafish larvae. Immediately following injection on 2 dpf, signal is primarily detectable in blood vessels such as the caudal artery (CA), caudal vein plexus (CVP), and intersegmental vessels (ISV). Later in development (4-6 dpf) signal is primarily localized to extravascular tissues such as the myosepta (MS), spinal cord (SC) and puncta in the caudal hematopoietic tissue (CHT) that likely correspond to macrophages (n=6). (d) When DiI-LDL is injected into the yolk, signal is undetectable in the vasculature of early-stage larvae, but in ~50% of cases (3 out of 6) will be detected in both vascular and extravascular tissues of later-stage larvae (n=6). (e) A solution of DiI injected into the larval yolk leads to a staining pattern that closely mirrors LipoGlo-microscopy experiments, indicating that it stains endogenous lipoproteins produced in the YSL (N=15). Results represent pooled data from three independent clutches, “n” denotes total number of samples per data point. Scale bars = 500 μm. Source data are provided as a Source Data file. |