
Fig. S7
- ID
- ZDB-FIG-190823-6
- Publication
- Thierer et al., 2019 - The LipoGlo reporter system for sensitive and specific monitoring of atherogenic lipoproteins
- Other Figures
- All Figure Page
- Back to All Figure Page
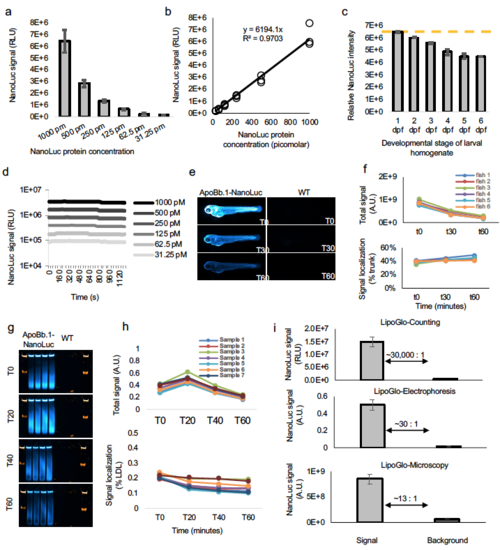
NanoLuc standard curves. (a) To determine the absolute concentration of ApoB-LPs in the larval homogenate, purified NanoLuc protein was ordered directly from Promega (Nluc-HT Protein, 500ug, 54.2KDa, #CS188401) and diluted to 1 nM working concentration in 1x ApoB-LP stabilization buffer. This solution was subjected to a 6-point series of 2-fold dilutions and used in a plate-based assay for NanoLuc activity (mean ± SD shown), and (b) showed the expected log-linear relationship. (c) There is a marked increase in pigmentation throughout larval development, causing homogenate to become progressively more opaque. To test the effect of pigment on NanoLuc readings, wild-type larvae that lack the ApoB-NanoLuc reporter were homogenized in ApoB-LP stabilization buffer at each stage of development. This homogenate was then supplemented with a final concentration of 1 nM NanoLuc protein and subjected to a plate read assay. As expected, the relative intensity of NanoLuc signal declines from 2 – 6 dpf, indicating that absolute quantitation of NanoLuc levels should include a standard curve that accounts for larval pigmentation (mean ± SD shown). (d) Analysis of LipoGlo counting signal over time (well values read every 40 seconds for 20 minutes) demonstrated that this assay is robust to slight fluctuations in incubation time, as signal half-lives were calculated to be greater than 60 minutes for all concentrations tested. (e) Analysis of LipoGlo microscopy signal over time revealed detectable signal well above background for over 60 minutes, and (f) although absolute signal declined over time (top panel), the signal localization remained relatively constant over short fluctuations in incubation time (bottom panel). (g) Analysis of LipoGlo electrophoresis signal over time (h) revealed that reads immediately after substrate addition (T0) were abnormally low (top panel) and biased toward detection of abundant lipoprotein species (bottom panel). However, following a brief incubation period (minimum of 5 minutes), absolute signal decays gradually over time, but changes in relative signal are much less pronounced (T20 – 60). (i) Quantification of the signal to background ratio of each of the LipoGlo assays, mean ± SD shown. Source data are provided as a Source Data file. |