
- Title
-
Truncating Variant in Myof Gene Is Associated With Limb-Girdle Type Muscular Dystrophy and Cardiomyopathy
- Authors
- Kiselev, A., Vaz, R., Knyazeva, A., Sergushichev, A., Dmitrieva, R., Khudiakov, A., Jorholt, J., Smolina, N., Sukhareva, K., Fomicheva, Y., Mikhaylov, E., Mitrofanova, L., Predeus, A., Sjoberg, G., Rudenko, D., Sejersen, T., Lindstrand, A., Kostareva, A.
- Source
- Full text @ Front Genet

Genetic and morphological data on MYOF loss of function variant. (A) A heterozygous variant p.G859QfsTer8 resulted from cis-change of 2-neighbor mutated nucleotides (aligned RAW-reads and allele cloning of PCR products). (B)Morphological examination performed on m. deltoideus, following hematoxylin-eosin staining. Variation in fiber size, nuclear centralization, and fat accumulation along with inflammatory cells infiltration are often observed. (C) Increased mRNA expression of MYOF, embryonic (MYH3), and developmental (MYH8) myosins in the patient’s skeletal muscle tissue compared to donor samples (n = 13). The patient’s sample is represented in red; donor samples in green and black. (D)Decrease by 65% of the MYOF level in the patient’s SM-MPC when compared with healthy control. The detected fragments correspond to full size MYOF transcript (234 kDa) and suspected cleavage products (74 and 160 kDa) [30]. (E) Immunostaining of SM-MPC: low intensity of MYOF staining in the patient’s cells, patchy aggregate distribution, and nuclear intensification of the signal compared to control cells (×100). Histogram demonstrates the distribution of larger aggregates in the patient’s cells. (F) Quantitative characterization of MYOF aggregates. Representative frequency distribution of aggregate area in the control and patient SM-MPC and comparison of the mean aggregate area values for the control and the patient. The graph is presented as Tukey box-plot.
|
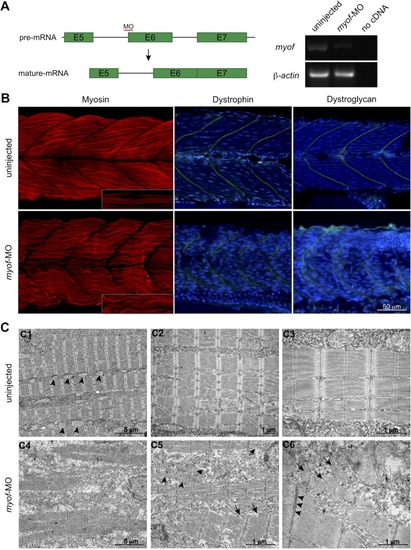
Loss of Myof affects the skeletal muscle of zebrafish embryos. (A)myof knockdown was achieved by injecting a splice-target morpholino (myof-MO). (B) Loss of Myof results in wavy and abnormally patterned myofibers (Myosin, red), and disruption of the myosepta, seen by a decreased intensity in the staining and increased width (Dystrophin and Dystroglycan, green). (C)Analysis of the myofiber ultrastructure by electron microscopy shows disruption of myofiber structure (C4) and their sarcomeres (arrows, C5, C6), abnormally shaped and distributed mitochondria (arrowheads, C5), when compared to control mitochondria (arrowheads, C1), and Z-disc thickening (arrowheads, C6).
|