
- Title
-
Rapid clearance of cellular debris by microglia limits secondary neuronal cell death after brain injury in vivo
- Authors
- Herzog, C., Pons Garcia, L., Keatinge, M., Greenald, D., Moritz, C., Peri, F., Herrgen, L.
- Source
- Full text @ Development

Mechanical injury induces two distinct phases of cell death in the optic tectum of larval zebrafish. (A) Bright-field image of the head of a larval zebrafish. Mechanical brain injury is induced by piercing the optic tectum with a fine metal pin. FB, forebrain; OT, optic tectum; HB, hindbrain. Scale bar: 100?µm. (B) Confocal images of the optic tectum of a H2A:GFP transgenic animal with PI before and immediately after mechanical injury. The damaged area of the cell body layer is outlined. Scale bar: 50?µm. (C) Quantification of injury volume at 0 hpi. n=15 animals. (D,E) Confocal images of PI (D) and H2A:GFP (E) from the animal shown in (B) at different time points after injury. Scale bars: 50?µm. (F,G) Higher magnifications of the boxed regions indicated in E. White arrows indicate pyknotic nuclei. Scale bars: 5?µm. (H) Quantification of PI+ cells and pyknotic nuclei over time after mechanical injury. Dashed line indicates time of injury. n≥9 animals per experimental group. (I) Heat maps illustrating the spatial distribution of pyknotic nuclei in H2A:GFP animals in the hours following injury. |

The majority of cells dying after brain injury are neurons. (A,C,E,G) Confocal images of the optic tectum of the neuronal reporter lines elavl3:GFP (A) and NBT:dsRed (E), and the radial glia reporter lines her4.3:GFP (C) and her4.3:mCherry (G). Scale bars: 50?µm. (B,D,F,H) Live imaging of PI+ cells in elavl3:GFP (B) or her4.3:GFP (D) animals at 0 hpi, and of pyknotic nuclei in NBT:dsRed;H2A:GFP (F) or her4.3:mCherry;H2A:GFP (H) animals at 6 hpi. Filled and empty arrows indicate colocalisation, or lack thereof, of cell death and cell type markers, respectively. Scale bars: 5?µm. (I,J) Quantification of elavl3+/PI+ and her4.3+/PI+ cells at 0 hpi (I) and of NBT+ and her4.3+ pyknotic nuclei at 6 hpi (J). n≥10 animals per experimental group. Each circle represents one set of results. Data are mean±s.e.m. |
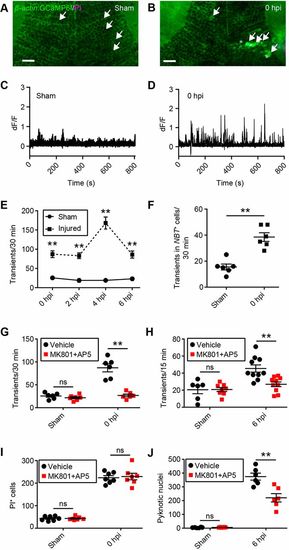
Excitotoxicity contributes to secondary cell death after brain injury in larval zebrafish. (A,B) Live imaging of calcium dynamics in the optic tectum of β-actin:GCaMP6f larvae in a sham animal (A) and an injured animal (B) at 0 hpi. White arrows indicate individual tectal cells. Scale bars: 20?µm. (C,D) Calcium traces from the individual tectal cells highlighted in A and B. (E) Quantification of calcium transients in sham and injured larvae during the time in which secondary cell death occurs. n=6 animals per experimental group. **P<0.01 using two-way ANOVA. (F) Quantification of calcium transients in tectal neurons, as shown by live imaging of β-actin:GCaMP6f;NBT:dsRed larvae. n=6 animals per experimental group. **P<0.01 using a Mann–Whitney test. (G,H) Quantification of calcium transients in tectal cells at 0 hpi (G) and 6 hpi (H) with MK801 and AP5. n≥6 animals per experimental group. ns, not significant and **P<0.01 in two-way ANOVA. (I,J) Quantification of PI+ cells at 0 hpi (I) and pyknotic nuclei at 6 hpi (J) with MK801 and AP5. n≥6 animals per experimental group. ns, not significant and **P<0.01 using two-way ANOVA. Data are mean±s.e.m. |

Microglia and skin macrophages rapidly migrate to the injury site, but skin macrophages rarely enter the brain. (A) Live imaging of the microglia/macrophage reporter line mpeg1:GFP at different time points after injury. Scale bar: 50?µm. (B) Quantification of mpeg1+ cells at the injury site within the brain. n=6 animals per experimental group. (C) Traces visualising cell body displacement of mpeg1+cells for 30?min before injury or in the 2?h after injury, in maximum intensity projections of z-stacks of the optic tectum. Scale bar: 50?µm. (D,E) Quantification of migration speed (D) and net displacement (E) of mpeg1+ cell bodies before and after injury. n=8 animals per experimental group. **P<0.01 using Student's t-test. (F) Confocal images of the optic tectum of a p2y12:GFP;mpeg1:mCherry animal at 6 hpi. Yellow arrows indicate p2y12+/mpeg1+ cells. Light-blue arrows indicate p2y12−/mpeg1+ cells. Scale bar: 40?µm. (G,H) Quantification of p2y12+/mpeg1+and p2y12−/mpeg1+ cells at the entire injury site (G) or within the brain (H). n=12 animals per experimental group. (I) Traces visualising cell body displacement of mpeg1+ skin macrophages in the hour after injury in a p2y12:GFP;mpeg1:mCherry animal in a maximum intensity projection of a z-stack of the optic tectum. Scale bar: 40?µm. (J) Quantification of the number of transitions of mpeg1+ skin macrophages into the brain in p2y12:GFP;mpeg1:mCherry animals within 6?h of injury. n=6 animals. Data are mean±s.e.m. |

Cell death after brain injury can be detected through Annexin A5 live imaging, caspase 3 immunohistochemistry, and TUNEL staining. (A,C,E) Confocal images of the tectum of a NBT:secA5-BFP animal (A), and animals after cleaved caspase 3 immunohistochemistry (B) or TUNEL staining (C), at different time points after injury. Scale bars, 50 μm. (B,D,F) Quantification of Annexin A5+ cells (B), cleaved caspase 3+ cells (D) or TUNEL+ cells (F). n ≥ 6 animals per experimental group. *, p < 0.05 and **, p<0.01 in two-way ANOVA |
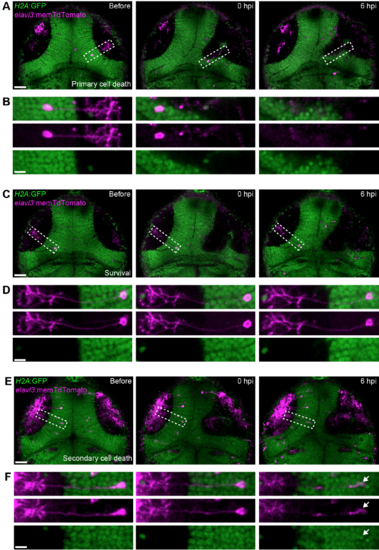
In vivo imaging of individual tectal neurons shows that both primary and secondary cell death occur after brain injury. (A,C,E) Confocal images of theoptic tectum of H2A:GFP transgenic animals, where tectal neurons labelled through injection of elavl3:memTdTomato plasmid DNA die through primary cell death (A), survive (C), or die through secondary cell death (E) after mechanical injury. Scale bars, 50 μm. (B,D,F) Close-up of neurons indicated in (A), (C) and (E). White arrow indicates pyknotic nucleus. Scale bars, 10 μm. |

Very few oligodendrocytes reside in the optic tectum at 4 dpf. (A) Confocal image of the optic tectum of a mbp:memGFP animal. Scale bar, 50 μm. (B) Quantification of mpb+ oligodendrocytes in the optic tectum. n = 10 animals. (C) Confocal image of the trunk region of a mbp:memGFP animal. White arrows indicate cell bodies of individual oligodendrocytes. Scale bar, 10 μm. |
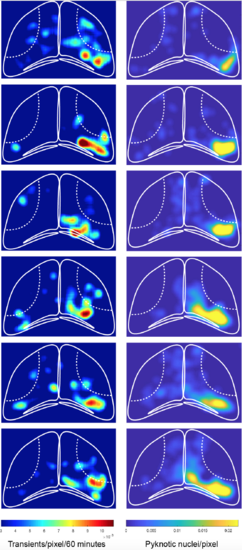
The spatial pattern of calcium transients correlates with regions of cell death. Heat maps illustrating the spatial distribution of calcium transients occurring between 2 and 3 hpi (left), and of pyknotic nuclei at 3 hpi (right), in the same animals. |
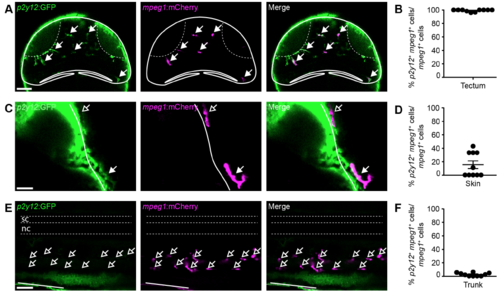
P2Y12 is expressed in virtually all mpeg1+ tectal cells and some mpeg1+ skin cells, but not in mpeg1+ cells in the trunk. (A,C,E) Confocal images of the optic tectum (A), skin (C), and trunk (E) of a p2y12:GFP;mpeg1:mCherry animal. Filled or empty arrows indicate colocalisation, or lack thereof, between p2y12 and mpeg1. Scale bars, 50 μm (A,E) and 20 μm (C). (B,D,F) Quantification of the proportion of p2y12+/mpeg1+ cells among all mpeg1+ cells in the tectum (B), skin (D) and trunk (F). n = 10 animals per experimental group |
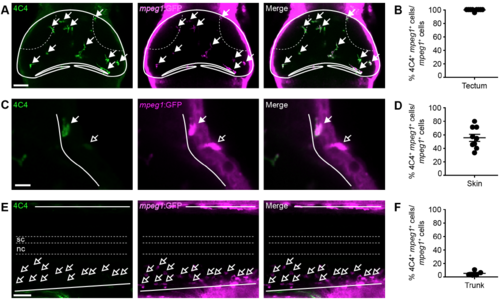
4C4 immunohistochemistry labels virtually all mpeg1+ tectal cells and some mpeg1+ skin cells, but not mpeg1+ cells in the trunk. (A,C,E) Confocal images of the optic tectum (A), skin (C) and trunk (E) of a mpeg1:GFP animal after 4C4 and GFP immunohistochemistry. Filled or empty arrows indicate colocalisation, or lack thereof, between 4C4 and mpeg1. Scale bars, 50 μm (A,E) and 20 μm (C). (B,D,F) Quantification of the proportion of 4C4+/mpeg1+ cells among all mpeg1+ cells in the tectum (B), skin (D) and trunk (F). n ≥ 5 animals per experimental group |
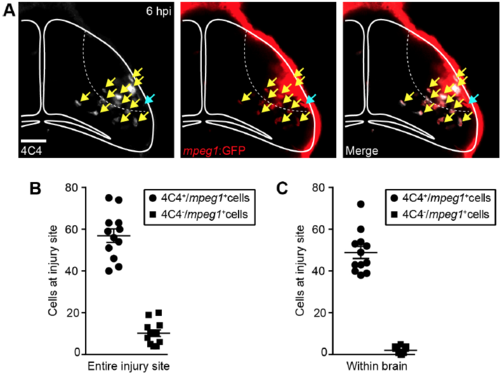
The majority of mpeg1+ cells at the injury site within the brain are also labelled by 4C4 immunohistochemistry. (A) Confocal images of the optic tectum at 6 hpi in mpeg1:GFP animals after 4C4 and GFP immunohistochemistry. Yellow arrows indicate 4C4+/mpeg1+ cells. Light blue arrow indicates a 4C4-/mpeg1+ cell. Scale bar, 40 μm. (B,C) Quantification of 4C4+/mpeg1+ and 4C4-/mpeg1+ cells at the entire injury site (B) or within the brain (C) at 6 hpi. n = 12 animals |
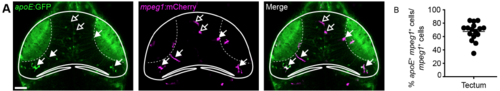
ApoE is expressed in a subset of mpeg1+ tectal cells. (A) Confocal images of the optic tectum of an apoE:GFP;mpeg1:mCherry animal. Filled or empty arrows indicate colocalisation, or lack thereof, between apoE and mpeg1. Scale bar, 50 μm. (B) Quantification of the proportion of apoE+/mpeg1+ cells among all mpeg1+ cells in the tectum. n = 16 animals |