
- Title
-
Macrophages target Salmonella by Lc3-associated phagocytosis in a systemic infection model
- Authors
- Masud, S., Prajsnar, T.K., Torraca, V., Lamers, G.E.M., Benning, M., Van Der Vaart, M., Meijer, A.H.
- Source
- Full text @ Autophagy

GFP-Lc3 recruitment to Salmonella during systemic infection of zebrafish. (a) Survival curves of Tg(CMV:GFP-map1lc3b) zebrafish embryos/larvae, systemically infected at 2 dpf by caudal vein injection with either live or heat-killed S. Typhimurium. One representative of three replicates is shown (n = 50 embryos per group). (b) CFU counts of the zebrafish infected with live or heat-killed S. Typhimurium. Five embryos/larvae per time point were used and the log-transformed CFU data are shown with the geometric mean per time point. One representative of three replicates is shown. (c) Stereo fluorescence image of a 2 dpf Tg(CMV:GFP-map1lc3b) embryo, systemically infected with live mCherry-expressing S. Typhimurium. The yellow dotted box shows the area in the tail used for Z-stack confocal imaging in d and e. (d and e) Representative confocal images at maximum projection taken at 4 hpi from time lapses recorded of embryos injected with live S. Typhimurium (e) or heat-killed S. Typhimurium (f) bacteria (see Movie M1 for live and M2 for heat-killed bacteria). Yellow boxes indicate the magnified regions shown in d’ and e’. The arrow in d’ indicates a ring-shaped structure of GFP-Lc3 signal enclosing an mCherry-expressing S. Typhimurium cell and several other GFP-Lc3-Salmonella associations can be observed in this image. (f) Quantification of GFP-Lc3-Salmonella associations at 4 hpi. Embryos injected with live or heat-killed S. Typhimurium were imaged over the yolk sac circulation valley region and quantified for percentages of phagocytes positive for GFP-Lc3-Salmonella associations (Lc3+ ve) over the total number of phagocytes with ingested bacteria. Error bars represent the SD. One representative of three replicates (each with n = 5 embryos per group) is shown. (g) Quantification of time course associations of GFP-Lc3-Salmonella during systemic infection with live S. Typhimurium. Five embryos per time point were imaged and quantified for percentages of phagocytes with GFP-Lc3-Salmonella associations as in f. Error bars represent the SD. Scale bars: c = 200 μm, d, e, d’ and e’ = 10 μm. ****P < 0.0001, ***P < 0.001, **P < 0.01, *P < 0.05, ns = non-significant. |
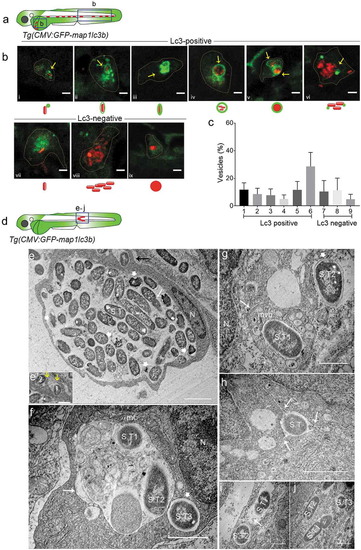
Types of Salmonella-containing vesicles in professional phagocytes. (a) Regions of interest (blue squares) for confocal images of infected phagocytes in the blood circulation in b. (b) Representative confocal micrographs for 6 distinctive patterns of GFP-Lc3 association with mCherry-expressing S. Typhimurium (bi-bvi) and 3 types of Lc3-negative cases (bvii-bix) observed in motile phagocytes in the tail and yolk sac regions at 4 hpi following systemic infection by caudal vein injection. Under each image the symbolic representation of the pattern is shown. Dotted lines outline the cellular boundaries of the phagocytes and yellow arrows point towards GFP-Lc3 association with bacterial cells. (c) Quantification of types of Lc3-positive and Lc3-negative Salmonella associations observed in b. Percentages of the 9 types of Lc3-positive and Lc3-negative vesicles were determined from images of Salmonella-infected phagocytes and averaged from 5 embryos (n > 30 Lc3+/Lc3− Salmonella associations per embryo, 196 in total). Error bars represent the SD. (d) Region of interest (blue square) in subcutaneously infected embryos for image acquisition through TEM in e to j. (e) TEM micrograph of a heavily infected macrophage with phagocytosed S. Typhimurium at 4 hpi, located in the lumen underneath the epidermis. Cytoplasm and nucleus (n) of the cell are pushed towards the cellular periphery and a large number of phagocytosed S. Typhimurium cells (S.T) are centrally contained in a large phagosomal compartment. The long white arrow indicates a dividing bacterial cell. The short thick white arrows indicate examples of dissociating Salmonella cells recognized by the retraction of the cytoplasm from the inner membrane. The black arrow indicates phagocytosing activity of the macrophage which is enlarged in e’. The yellow arrows in e’ point to membrane ruffles of the macrophage formed to enclose extracellular S. Typhimurium (1 and 2). Figure S1 shows a broader view of this macrophage in the tissue context. (f) TEM micrograph showing two S. Typhimurium-containing compartments. The larger compartment (long arrow) contains cellular debris in addition to bacterial cells (S.T1 and S.T2). The lumen of the smaller vesicle (short thick arrow), which holds a single bacterium (S.T3), is clean. The nucleus (n) and a mitochondrion (mt) in close vicinity of the bacterial compartments are indicated. (g) TEM micrograph of S. Typhimurium (S.T1) inside a multi-vesicular body (MVB, long arrow). The short thick arrow indicates a cytoplasmic Salmonella cell (S.T2) with intact outer and inner bacterial membrane. (h) TEM of S. Typhimurium (S.T1) inside a vesicle that forms tubular extensions into the cytoplasm (arrows). (i) TEM showing S. Typhimurium cells (S.T1 and S.T2) inside two single membrane-bound compartments. The presence of ribosomes (arrow) in the internal environment suggests membrane damage. (j) TEM of three S. Typhimurium (S.T) cells in the cytoplasm, one of which (S.T1) is replicating. Scale bars: b = 5 μm, e-j = 2 μm, e’ = 1 μm. |

GFP-Lc3–Salmonella associations in specific phagocyte types. (a) Region of interest (blue square) for confocal images of infected phagocytes in the blood circulation in b. (b) Confocal micrographs in series (i–viii) of distinctive patterns of GFP-Lc3 associations with mCherry-expressing S. Typhimurium in macrophages (MΦ, TSA negative/Lcp1 positive; i-vi) and neutrophils (NΦ, TSA positive/Lcp1 positive; vii,viii). The dotted lines in the overlay image of the separate channels indicate the cellular boundaries. The symbolic presentations shown next to the images refer to the different types of GFP-Lc3-Salmonella associations presented in Figure 2(b). (c) Quantification of phagocytosing activity of macrophages and neutrophils in systemic and sub-cutaneous infections at 4 hpi. Numbers of infected and non-infected phagocytes were counted from confocal images and the percentages of infected over the total were averaged from five embryos per group. Error bars represent the SD. Macrophages (MΦ) and neutrophils (NΦ) were distinguished by anti-Lcp1 and TSA staining as in b. (d) Quantification of GFP-Lc3-Salmonella associations in macrophages and neutrophils at 4 hpi. Numbers of infected phagocytes positive or negative for GFP-Lc3-Salmonella associations were counted from confocal images and the percentages of Lc3-positive over the total were averaged from five embryos per group. Error bars represent the SD. Macrophages (MΦ) and neutrophils (NΦ) were distinguished by anti-Lcp1 and TSA staining as in b. Scale bars: b = 2 μm. ****P < 0.0001, ***P < 0.001, **P < 0.01. |

ZFIN is incorporating published figure images and captions as part of an ongoing project. Figures from some publications have not yet been curated, or are not available for display because of copyright restrictions. PHENOTYPE:
|

Roles of autophagy-related proteins in the host response to Salmonella infection. (a) Region of interest (blue square) for confocal image acquisition of infected phagocytes in the blood circulation in d, h, l and p. (b, f, j and n) Survival curves of systemic S. Typhimurium infection experiments of atg5 (b), atg13 (f), rubcn kd(1) (j) and rubcn kd(2) (n) morpholino knockdown groups with their respective control morpholino-injected groups. Kd1 and kd2 refer to use of translation blocking (MO1-rubcn) and splice blocking (MO2-rubcn) morpholinos, respectively. For each comparison one representative of three replicates is shown. Survival was scored at 24, 48 and 72 hpi, following infection at 48 hpf. (c, g, k and o) Representative CFU counts of the S. Typhimurium infections of atg5 (c), atg13 (g), rubcn kd(1) (k) and rubcn kd(2) (o) morpholino knockdown groups with their respective controls at 24 hpi. Five embryos/larvae per time point were used and the log transformed CFU data are shown with the geometric mean per time point. (d, h, l and p) Representative confocal images of atg5 (d’), atg13 (h’), rubcn kd(1) (l’) and rubcn kd(2)’ (p’) morpholino knockdown embryos with their respective controls (d, h, l and p) at 4 hpi. (e, i, m and q): Quantification of GFP-Lc3-Salmonella associations in atg5 (e), atg13 (i), rubcn kd(1) (m) and rubcn kd(2) (q) morpholino knockdown groups with their respective controls at 4 hpi. Numbers of infected phagocytes positive or negative for GFP-Lc3-Salmonella associations were counted from confocal images and the percentages of Lc3-positive over the total were averaged from five embryos per group. Error bars represent the SD. Scale bars: 10 μm. ****P < 0.0001, ***P < 0.001, **P < 0.01, *P < 0.05, ns = non-significant. |
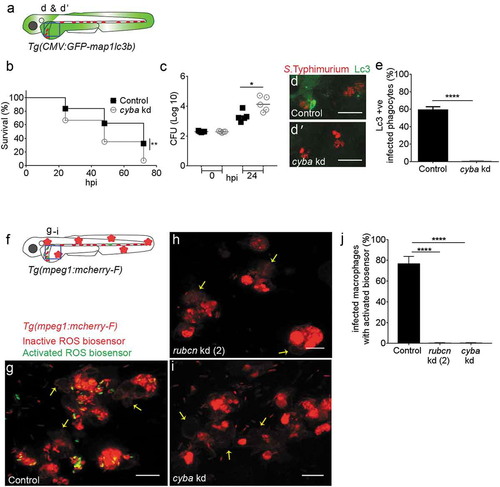
(a) Region of interest (blue square) for confocal image acquisition of infected phagocytes in the blood circulation in d and d’. (b) Survival curves of S. Typhimurium-infected control and cyba knockdown embryos. One representative of three replicates is shown. (c) Representative CFU counts of S. Typhimurium- infected control and cyba knockdown embryos. Five embryos/larvae per time point were used and the log transformed CFU data are shown with the geometric mean per time point. (d) Representative confocal images of control (d) and cyba (d’) knockdown embryos at 4 hpi. (e) Quantification of GFP-Lc3-Salmonella associations in control and cyba knockdown embryos at 4 hpi. Numbers of infected phagocytes positive or negative for GFP-Lc3-Salmonella associations were counted from confocal images and the percentages of Lc3-positive over the total were averaged from five embryos per group. Error bars represent the SD. (f) Region of interest (blue square) for confocal image acquisition of infected phagocytes in the blood circulation of Tg(mpeg1:mCherry-F) embryos in g-i. Red stars symbolize the mCherry-expressing macrophages in the transgenic line used for this experiment. (g-i) Representative confocal images of Tg(mpeg1:mCherry-F)umsF001 embryos at 4 hpi following injection of a Salmonella ROS biosensor strain into control (g), and rubcn kd(2) (h) or cyba morpholino knockdown groups (i). The ROS biosensor strain expresses a constitutive mCherry marker and the GFP signal indicates ROS biosensor activation. Macrophages in the Tg(mpeg1::mCherry-F) line express a farnesylated mCherry protein localizing to membranes (arrows) and therefore the signal is separated from bacterial mCherry signal. (j) Quantification of ROS biosensor activation at 4 hpi in control, rubcn kd(2) and cyba morpholino knockdown groups of Tg(mpeg1::mCherryF) embryos at 4 hpi. Numbers of macrophages showing ROS biosensor activation (GFP and mCherry bacterial signals) or without ROS biosensor activation (mCherry bacterial signal only) were counted from confocal images and the percentages of ROS biosensor-positive over the total were averaged from five embryos per group. Error bars represent the SD. Scale bars: 10 μm. ****P < 0.0001, **P < 0.01, *P < 0.1. |

Macrophages target Salmonella by Lc3-associated phagocytosis in a systemic infection model |