
- Title
-
Promoter architecture and transcriptional regulation of musculoskeletal embryonic nuclear protein 1b (mustn1b) gene in zebrafish
- Authors
- Suarez-Bregua, P., Chien, C.J., Megias, M., Du, S.D., Rotllant, J.
- Source
- Full text @ Dev. Dyn.
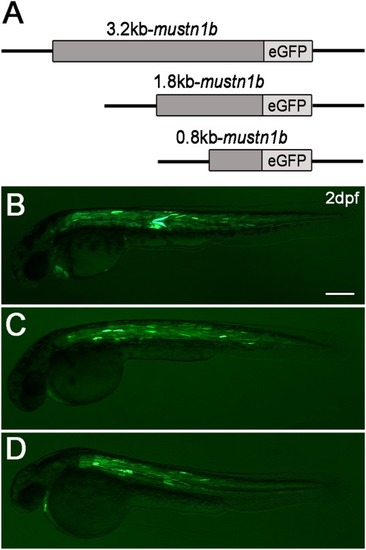
Transient expression analysis of mustn1b:eGFP in 2‐dpf Zebrafish embryos. A: Schematic diagram of the Zebrafish eGFP reporter gene construct containing a mustn1b promoter region of 3.2 kb (P1), 1.8 kb (P2), 0.8 kb (P3), and 5′‐flanking sequences. B–D: eGFP expression in skeletal and cardiac muscles of Zebrafish embryos injected with mustn1b:eGFP constructs that contain the 3.2 kb (P1) (B), 1.8 kb (P2) (C), or 0.8 kb (P3) (D) mustn1b gene promoter and 5′‐flanking sequences, respectively. Scale bars = 200 μm. |

Whole‐mount confocal imaging and in situ hybridization of the stable Tg(mustn1b:eGFP)iim01 line embryos and larvae. A: Expression of eGFP reporter gene in muscle pioneer cells and somites in 30‐hpf transgenic embryos. The white arrowhead indicates the strong eGFP expression in a marked stripe of muscle pioneer cells adjacent to the notochord. A1–A4: Confocal imaging of cross‐sections from 30‐hpf transgenic embryo. B: Whole‐mount in situ hybridization showing expression of mustn1b mRNA in muscle pioneer cells and somites in 30‐hpf embryos. The black arrowhead indicates mustn1b gene expression in the stripe of muscle pioneer cells adjacent to the notochord. B1–B4: Cross‐sections from 30‐hpf embryo with in situ hybridization staining. C–F: eGFP expression in mononucleated skeletal and heart muscles of transgenic Zebrafish at 2, 4, and 7 dpf. E,G: eGFP expression in craniofacial and fin muscles of transgenic larvae at 4 and 7 dpf. e, eye; am, adductor mandibularis; hh, hyohyal; ih, interhyal; ima, intermandibularis anterior; imp, intermandibularis posterior; io, inferior oblique; ir, inferior rectus; sh, sternohyoideus; lap, levator arcus palatine; ah, adductor hyoideus; ao, adductor operculae; do, dilator operculae; lo, levator operculae; bl5, 5th branchial levator; bl1‐4, 1st–4th branquial levators; tv, transversus ventralis; pfm, pectoral fin muscles. Scale bars A,B,C,E = 200 μm. Scale bars A1–A4 = 50 μm. Scale bars B1–B4 = 25 μm. Scale bars D,F,G = 100 μm. |

Expression of eGFP reporter gene in adult Tg(mustn1b:eGFP)iim01 Zebrafish. Transverse body cryosections were analyzed for eGFP fluorescence. A,B: A marked eGFP expression is detected in jaw, cranial muscles, tongue, and heart. C–E: eGFP expression is also found in esophagus and the external muscle layer of intestine. D–F: Trunk transverse sections show slight eGFP expression in supracarinalis anterior, lateralis superficialis, and hypaxial muscles. e, eye; am, adductor mandibularis; ih, interhyal; cm, cranial muscles; hh, hyohyal; t, tongue; h, heart; es, esophagus; sca, supracarinalis anterior; ls, lateralis superficialis; hyp, hypaxial muscles; int, intestine. Scale bar = 400 μm. EXPRESSION / LABELING:
|

Expression of eGFP reporter gene in slow and fast muscle fibers of Tg(mustn1b:eGFP)iim01 embryos and larvae. eGFP expression was analyzed in the mustn1b:eGFP; Myomesin‐3‐RFP double transgenic fish embryos at 2 and 6 dpf. A–C: mustn1b:eGFP expression co‐localized with Myomesin‐3‐RFP‐positive slow muscles at 2 dpf. In the enlarged pictures (a–c), eGFP protein showed a sarcomeric localization in the myofibers. D–F: mustn1b:eGFP expression in Myomesin‐3‐RFP‐positive slow muscles at 6 dpf. G,H; Localization of eGFP expression in fast muscle fibers of transgenic Zebrafish at 2 and 6 dpf, respectively. Scale bars A, D, G = 30 μm. Scale bars a = 6 μm. |
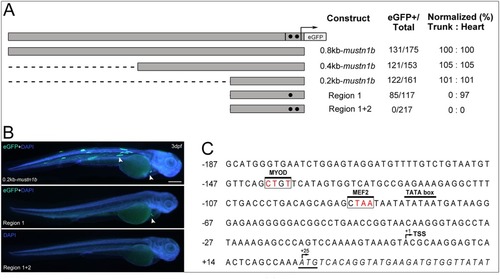
Functional analysis of the mustn1b promoter through eGFP expression. A: DNA fragments containing 0.8 (P3), 0.4 (P4), and 0.2 kb (P5) sequences upstream from the ATG of mustn1b are in gray. Black circles mark conserved regions selected for mutations. Region 1, positions ‐138 ‐141 (transcription factor binding site [TFBS]: MYOD) and Region 2, positions ‐86 ‐89 (TFBS: MEF2). Arrow and hatched section denote the start of transcription and 5'UTR, with eGFP coding sequences substituting at the native ATG start site. Promoter activity was assessed as the proportion of embryos displaying one or more fluorescent mustn1b cells and normalized to the 0.8kb‐mustn1b promoter results. B: Transient expression analysis of 3‐dpf Zebrafish embryos injected with 211bp_mustn1b‐Tol2‐eGFP, Region 1, and Region1 + 2 site‐directed mutagenesis constructs. The white arrowheads indicate the eGFP expression in skeletal muscles and heart. Counterstaining with DAPI was used to visualize nuclei (blue). C: Nucleotide sequence of the Zebrafish mustn1b gene showing the distribution in the promoter region of targeted transcription‐factor binding boxes for site‐directed mutagenesis. Nucleotides are shown in uppercase letters and numbered on the left of the sequence. The transcription start site (TSS) in the 5'‐UTR is denoted by (+1). and the coding region, in italics, shows the ATG start site denoted by (+25). Transcription‐factor binding regions of interest in white box and mutated nucleotides in red. The TATA box is marked by black overhead line. Scale bars = 250 μm. |