
Image
|
Figure Caption
Fig. 2
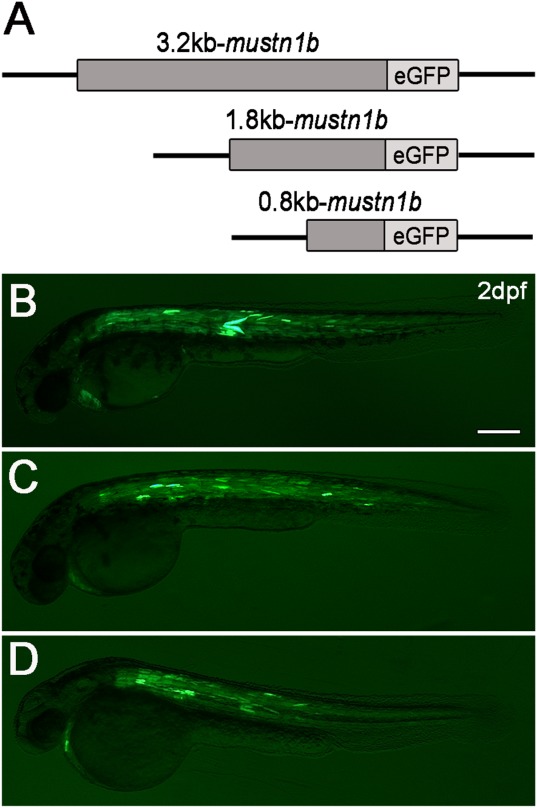
Transient expression analysis of mustn1b:eGFP in 2‐dpf Zebrafish embryos. A: Schematic diagram of the Zebrafish eGFP reporter gene construct containing a mustn1b promoter region of 3.2 kb (P1), 1.8 kb (P2), 0.8 kb (P3), and 5′‐flanking sequences. B–D: eGFP expression in skeletal and cardiac muscles of Zebrafish embryos injected with mustn1b:eGFP constructs that contain the 3.2 kb (P1) (B), 1.8 kb (P2) (C), or 0.8 kb (P3) (D) mustn1b gene promoter and 5′‐flanking sequences, respectively. Scale bars = 200 μm.
Acknowledgments
This image is the copyrighted work of the attributed author or publisher, and
ZFIN has permission only to display this image to its users.
Additional permissions should be obtained from the applicable author or publisher of the image.
Full text @ Dev. Dyn.