
- Title
-
Dissecting the role of Wnt signaling and its interactions with FGF signaling during midbrain neurogenesis
- Authors
- Dyer, C., Blanc, E., Stanley, R.J., Knight, R.D.
- Source
- Full text @ Neurogenesis (Austin)
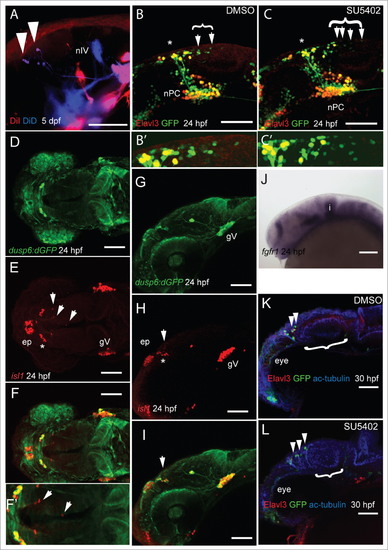
FGF signaling dictates the spatial positioning of MTN neurons in the midbrain during development. DiI (red) labeling of masseter and and DiD (blue) labeling of levator arcus palatini and lateral rectus cranial muscles in 5 dpf larvae leads to retrograde labeling of MTN neurons in the anterior midbrain (A). Lateral views of Tg[elavl3:egfp] embryos labeled with anti-GFP (green) and anti-Elavl3 (HuC/D, red) reveals the presence of more MTN neurons (arrowheads) at posterior locations in the midbrain following treatment with 40mM SU5402 from 14–24 hpf (C) relative to DMSO exposure (B). Bracket indicates extent of MTN neurons (represented by enlarged area in B' and C'). Dorsal (D–F) and lateral (G–I,) views of 24 hpf Tg [dusp6:d2eGFP] embryos processed with anti-GFP (green) and anti-Isl1 (red). A zoomed dorsal view (F) reveals that neurons of the nucleus of the tract of the posterior commissure (nTPC, asterisk) and MTN neurons (arrowheads) develop in regions devoid of anti-GFP labeling. At 24 hpf, fgfr1 expression is absent from the anterior midbrain (J). Lateral views of 30 hpf Tg[dlx5a/6a:eGFP] embryos labeled with anti-Elavl3 (red), anti-acetylated tubulin (blue) and anti-GFP (green) reveals more MTN neurons (arrowheads) and a reduced optic tectum (bracket) following exposure to 40mM SU5402 (L) from 14–24 hpf compared to DMSO treated control animals (K). Nucleus of the posterior commissure (nPC), trochlear nerve (nIV). Scale bars: 50mm (A), 100mm (B–L). |
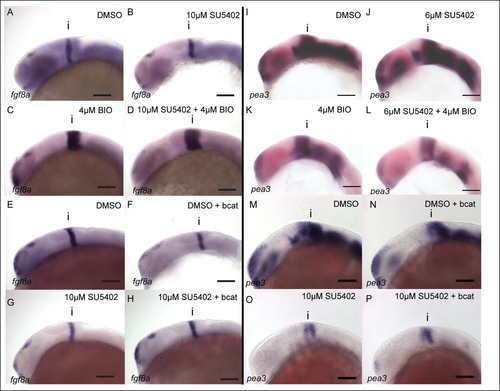
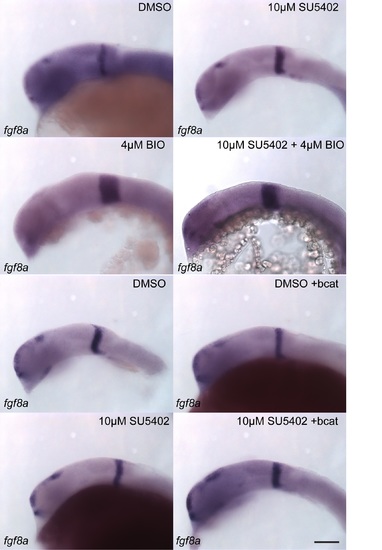
FGF activity in the midbrain is GSK-3 dependent, but is not regulated by β-catenin. Expression of fgf8a (A–H) and pea3 (I–P) was visualized by in situ hybridization in 24 hpf embryos treated with DMSO (A, E, I, M), SU5402 at 10µM or 6µM (B, G, J, O), BIO at 4µM (C, K), SU5402 and BIO together (D, L), when over-expressing bcat (F, N), when over-expressing bcat and treated with SU5402 (H, P). Isthmus (i). Scale bars: 100µm. |
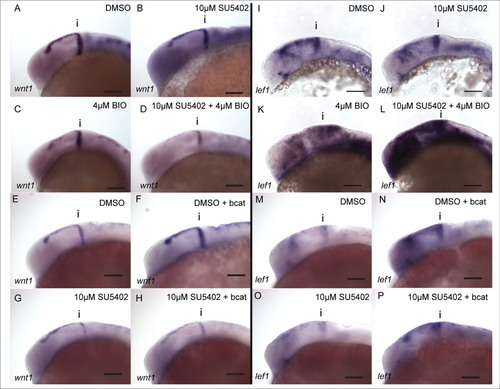
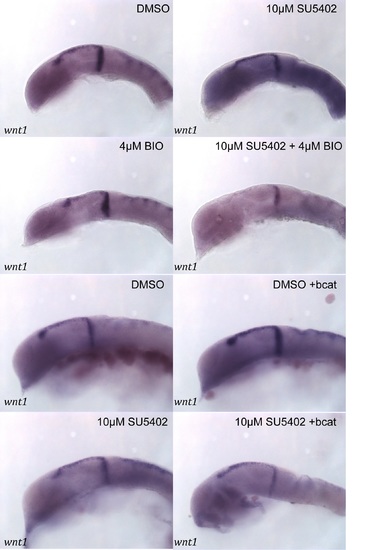
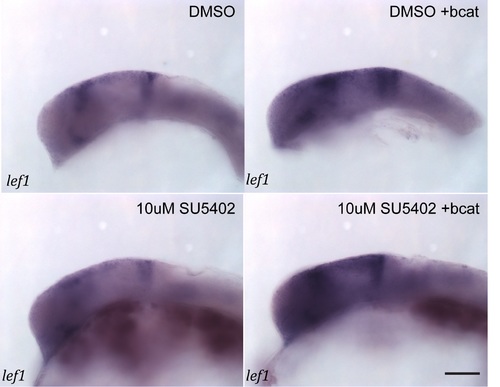
wnt1 in the midbrain is GSK-3 dependent, but is not regulated by β-catenin. Expression of wnt1 (A–H) and lef1 (I–P) was visualised by in situ hybridization in 24 hpf embryos treated with DMSO (A, E, I, M), SU5402 at 10µM (B, G, J, O), BIO at 4µM (C, K), SU5402 and BIO together (D, L), when over-expressing bcat (F, N), when over-expressing bcat and treated with SU5402 (H, P). Isthmus (i). Scale bars: 100µm. |
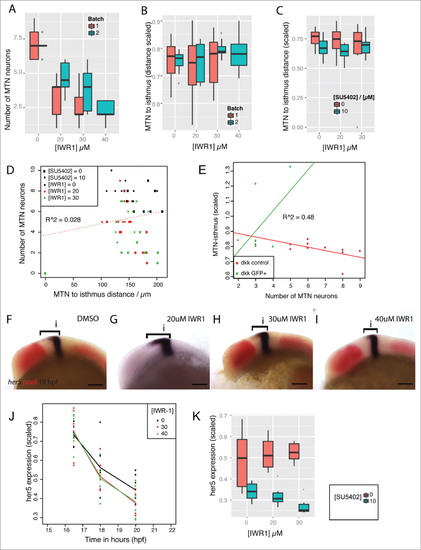
Tankyrase activity does not affect positioning of MTN neurons or FGF directed her5 expression in the dorsal midbrain. Box plot of the number of MTN neurons (A) or MTN-isthmus distance (scaled by midbrain size, B) in 2 separate clutches of embryos (red, blue) treated with 0, 20, 30, 40mM IWR-1 from 14–24 hpf (n = 10 for each condition). Box plot of MTN-isthmus distance (scaled) in 24 hpf embryos treated with DMSO (red) or 10mM SU5402 (blue) in conjunction with IWR-1 (C, n = 10 for each condition). Dot plot of MTN neuron number relative to MTN-isthmus distance (scaled) for embryos treated with IWR-1 (0, 20, 30, 40mM) and SU5402 (0, 10mM) from 14 hpf (D). A correlation test reveals no correlation between neuron number and distance (R = 0.028, n = 10 for each condition). Dot plot of MTN-isthmus distance (scaled) relative to MTN number in 24 hpf control embryos (red) or Tg[hsp70l:dkk1b-gfp] embryos expressing dkk1b (green) from 16.5 hpf (E). A correlation test reveals no correlation between MTN neuron number and distance (R = 0.48, n = 10 for each condition). Lateral views of 18 hpf embryos processed by in situ hybridization to reveal expression of her5 (blue, bracket indicates expression extent in dorsal midbrain) and pax6 (red) following treatment with IWR-1 at 0, 20, 30, 40mM IWR-1 from 14 hpf (F-I). A line plot of the her5 expression domain in the dorsal midbrain (scaled to midbrain size) in embryos treated with IWR-1 at 0, 30, 40mM from 14 hpf at 16.5, 18, 20 hpf (J, n = 10 for each condition). Box plot of her5 expression domain in the dorsal midbrain (scaled) in 24 hpf embryos treated with IWR-1 at 0, 20, 30mM and SU5402 at 0 (red) and 10mM (blue) from 14 hpf (K, n = 10 for each condition). Isthmus (i). Scale bars: 100mm. |
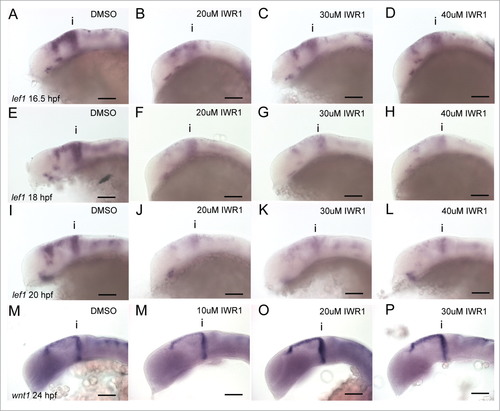
Tankyrase inhibition does not lead to linear reductions of bcat activity over time. Lateral views of 16.5 (A–D), 18 (E–H), 20 hpf (I–L) embryos processed by in situ hybridization to reveal expression of lef1 expression following treatment with IWR-1 at 0, 20, 30, 40 µM IWR-1 from 14 hpf. Lateral views of 24 hpf embryos processed by in situ hybridization to reveal expression of wnt1 expression following treatment with IWR-1 at 0, 20, 30, 40 µM IWR-1 from 14 hpf. Isthmus (i). Scale bars: 100µm. |
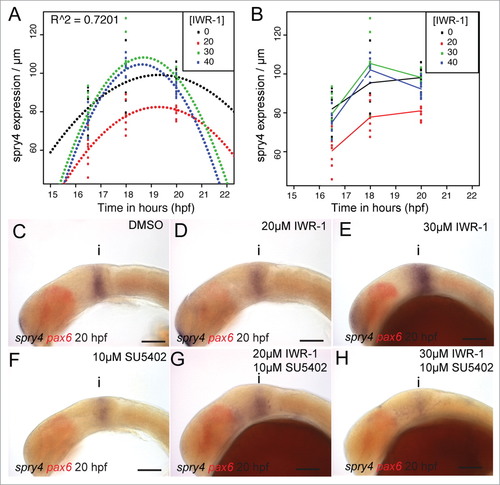
spry4 shows a bivalent response to changes in Wnt and FGF signaling. Polynomials were fitted against the spatial expression of spry4 in the dorsal midbrain (µm) at 16.5, 18, 20 hpf following treatment with IWR-1 from 14 hpf (A) and showed a good fit (R2 = 0.7201, n = 10 for each condition). A line plot of the spry4 expression domain (scaled to midbrain size) in the same embryos (B) reveals that treatment with 20µM IWR-1 had the strongest affect (n = 10 for each condition). Lateral views of 20 hpf embryos processed by in situ hybridization to reveal spry4 (blue) and pax6 (red) expression following treatment from 14 hpf with DMSO (C), 20µM IWR-1 (D), 30µM IWR-1 (E), 10µM SU5402 (F), 20µM IWR-1 with 10µM SU5402 (G), or 30µM IWR-1 with 10µM SU5402 (H). Isthmus (i). Scale bars: 100µm (C–H). |

Masterblind mutants possess more MTN neurons, but do not show a posterior displacement of MTN neurons. Lateral views of 24 hpf embryos processed by in situ hybridization to reveal elevated axin2 expression in midbrain (bracket) of masterblind mutants (mbl, B), relative to wildtype siblings (sibs, A). Box plot of the number of MTN neurons (C) or MTN-isthmus distance (scaled by midbrain size, D) in 24 hpf mbl mutants and sibs (n = 10 for each condition). There is a strong effect by mbl on MTN number (p = 2.8 × 10⁻⁴) but not on MTN-isthmus distance (p = 0.064). Dot plot of MTN number against MTN-isthmus distance (scaled) for mbl mutants and sibs (E). A line of best fit reveals no correlation between MTN neuron number and distance (R = 0.19, n = 10 for each condition). Isthmus (i). Scale bars: 100µM (A,B). |
|

|
|
|