
- Title
-
Males develop faster and more severe hepatocellular carcinoma than females in krasV12 transgenic zebrafish.
- Authors
- Li, Y., Li, H., Spitsbergen, J.M., Gong, Z.
- Source
- Full text @ Sci. Rep.

Male krasV12 zebrafish developed HCC faster than female during early tumorigenesis. (A–D) Representative liver images from female (F) and male (M) wild type (wt) and krasV12 fish (4 months old) after 10 days of doxycycline induction. The livers are outlined in dash lines. (E–H) Representative liver histology by H&E staining from fish as described in (A–D). (I) 2D liver sizes measured from the left lateral side. The liver size of wild type females (wt_F) is arbitrarily set as 1 and the sizes in other groups are relative to wt_F. (n = 15 for each group, *p < 0.05). (J) Quantification of histological phenotypes of livers from female and male krasV12 zebrafish (**p < 0.01). (K) Fold change of krasV12 expression in female (set as 1) and male (relative to kras_F) krasV12 fish (NS, not significant). Scale bars, 2 mm for (A–D) and 20 μm for (E–H). PHENOTYPE:
|
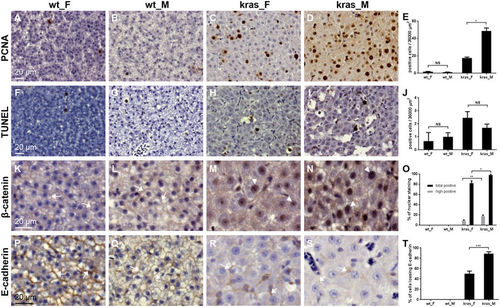
The male tumors were characterized by higher level of cell proliferation, β-catenin activation and E-cadherin loss. Representative immunohistochemical staining of liver sections from female and male wild type and krasV12 fish (4 months old) after 10 days of doxycycline induction are shown. (A–D) Immunohistochemical staining for PCNA. (E) Quantification of PCNA nuclear staining. (F–I) TUNEL staining for apoptotic cells. (J) Quantification of apoptotic cells. (K–N) Immunohistochemical staining for β-catenin. (O) Quantification of β-catenin nuclear staining. (P–S) Immunohistochemical staining for E-cadherin. (T) Quantification of cells losing E-cadherin membrane staining. *p < 0.05; **p < 0.01; ***p < 0.001; NS: not significant. Scale bar, 20 μm for all picture panels. Examples of membrane and nuclear staining are indicated by arrows and arrowheads, respectively. |
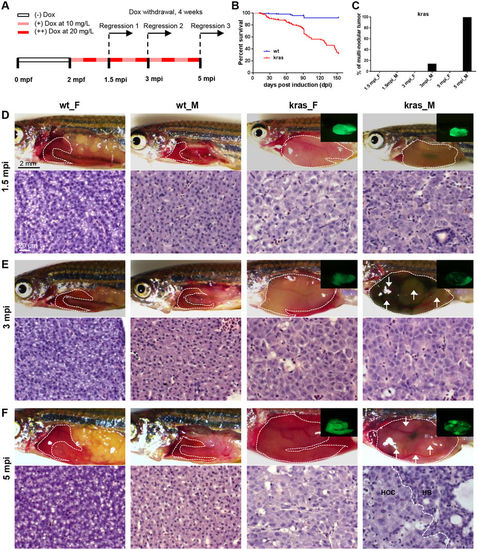
Male krasV12 zebrafish developed more severe liver tumors during long-term tumor induction. (A) Diagram of experimental design and schedules of sample collection for the long-term tumor induction. (B) Kaplan-Meier survival curve of wt and krasV12 fish. (C) Quantification of the percentage of multi-nodular tumors (n = 5–8 for each group). (D–F) Representative images and liver histology from female and male wild type and krasV12 fish at 1.5 mpi (D), 3 mpi (E) and 5 mpi (F). The livers are outlined in dash lines as well as marked by GFP expression in krasV12 fish. Multi-nodular tumor was observed only in male krasV12 fish at 3 mpi and 5 mpi. Individual nodules are indicated by GFP expression as shown in inlets for krasV12 fish and also pointed by arrows in the brightfield images. The multi-nodular tumors at 5 mpi were characterized by mixed types of HCC and HB separated by dash lines in the H&E staining. Scale bars, 2 mm for gross observation pictures and 20 μm for histology images. PHENOTYPE:
|
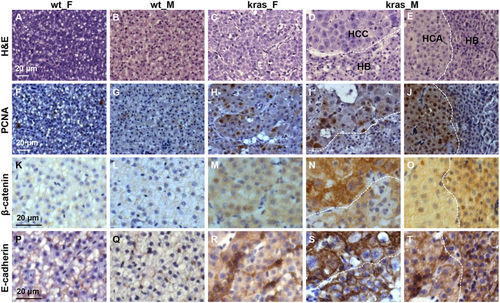
Characterization of the multi-nodular liver tumor from male krasV12 zebrafish after long-term tumor induction. Adjacent liver sections in female and male wild type and krasV12 fish at 5 mpi were processed for H&E and immunohistological staining. The multi-nodular male tumors have mixed types of tumors (HCC, HB and HCA) which were separated by dash lines. (A–E) H&E staining. (F–J) Immunocytochemical staining for PCNA. (K–O) Immunohistochemical staining for β-catenin. (P–T) Immunohistochemical staining for E-cadherin. Scale bar, 20 μm for all panels. |

Withdrawal of doxycycline caused slower liver tumor regression in male krasV12 fish. Representative images, liver histology and PCNA immunostaining from female and male wild type and krasV12 fish after doxycycline withdrawal at 5 mpi are shown. (A–C) Gross observation (A), liver histology (B) and PCNA staining (C) of wt-F fish after 4 weeks of doxycycline withdrawal. (D–F) Gross observation (D), liver histology (E) and PCNA staining (F) of wt-M fish after 4 weeks of doxycycline withdrawal. (G–I) Gross observation (G), liver histology (H) and PCNA staining (I) of kras-F fish after 4 weeks of doxycycline withdrawal. Complete tumor regression in females after four weeks of doxycycline withdrawal were observed as indicated by the normal histology and PCNA staining. (J–L) Gross observation (J), liver histology (K) and PCNA staining (L) of kras-M fish after 4 weeks of doxycycline withdrawal. Incomplete tumor regression in males after four weeks of doxycycline withdrawal was indicated by the relatively larger liver size, extensive scar (marked by black asterisk) and high rate of PCNA-positive cells. (M–O) Gross observation (M), liver histology (N) and PCNA staining (O) of kras-M fish after 8 weeks of doxycycline withdrawal. Complete regression of male tumors after 8 weeks of doxycycline withdrawal. N = 5–8 for each group. Scale bars, 2 mm for gross observation pictures and 20 μm for histology images. |
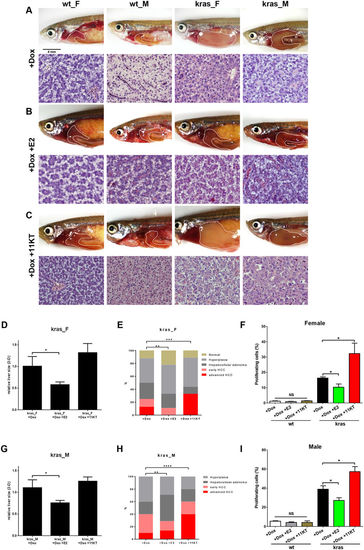
Sex hormone treatments affected cell proliferation during liver tumor progression in krasV12 fish. Wild type (wt) and krasV12 fish (4 months old) were treated with dox (doxycycline) alone, dox and E2, and dox and 11-KT, respectively, for a total of 7 days. (A–C) Representative gross observations and histology of wt and krasV12 fish after treatment with dox (A), dox and E2 (B), dox and 11-KT (C). (D–F) Relative 2D liver size (D), quantification of tumor phenotypes observed from the liver histology (E) and quantification of the proliferating cells (%) in different female treatment groups (F). (G–I) Relative 2D liver size (G), quantification of tumot phenotypes observed from the liver histology (H) and quantification of the proliferating cells (%) in different male treatment groups (I). N = 4–5 per group for wt, n = 7–10 per group for krasV12. *p < 0.05; **p < 0.01; ***p < 0.001; ****p < 0.0001; NS: not significant. Scale bars, 4 mm for gross observation pictures and 20 μm for histology images. |
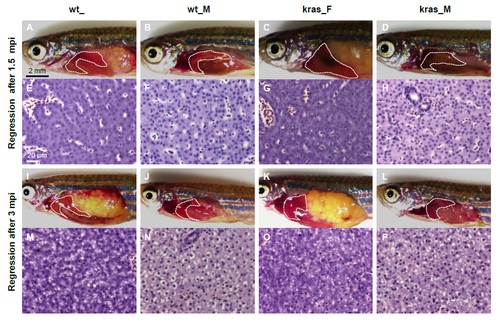
Tumor regression at 1.5 mpi and 3 mpi after four weeks of doxycycline withdrawal. Representative images and liver histology from female and male wild type and krasV12 fish are shown. (A-H) Liver morphology (A-D) and histology (E-H) after four weeks of doxycycline withdrawal at 1.5 mpi. (I-P). Liver morphology (IL) and histology (M-P) after four weeks of doxycycline withdrawal at 3 mpi. Complete tumor regression was observed in in all the female and malekrasV12 fish, indicated by normal liver size and histology. Scale bars: 2 mm in (A-D) and (I-L); 20 μm in (E-H) and (M-P). |

Effects of sex hormones on cell proliferation during liver tumor progression in adult krasV12 zebrafish. Wild type (wt) and krasV12 fish (4 months old) were treated with dox (doxycycline) alone, dox and E2, and dox and 11-KT, respectively, for a total of 7 days. Liver sections were stained for PCNA. (A-L) Representative images of PCNA staining of female and male wt and krasV12 liver after treatments of dox (A-D), dox and E2 treatment (E-H), or dox and 11-KT (I-L). Scale bar, 20 μm for all panels. |