
- Title
-
Accelerated Optical Projection Tomography Applied to In Vivo Imaging of Zebrafish
- Authors
- Correia, T., Lockwood, N., Kumar, S., Yin, J., Ramel, M.C., Andrews, N., Katan, M., Bugeon, L., Dallman, M.J., McGinty, J., Frankel, P., French, P.M., Arridge, S.
- Source
- Full text @ PLoS One
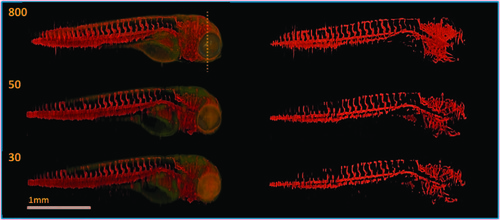
TraNac Tg(KDR:mCherry) zebrafish embryo images reconstructed from the densely sampled (800 projections) and down-sampled data sets of 50 and 30 projections. (Left) Images reconstructed from the fluorescence [red] and transmission projection images [green] and (right) corresponding segmentation images. The number of projections used to reconstruct each image is indicated in the corresponding subfigure (left). Note that the loss of resolution at the zebrafish tail is attributed to the live embryo moving its tail outside the depth of field of the imaging system during the experiment. Scale bar pertains to all images. |
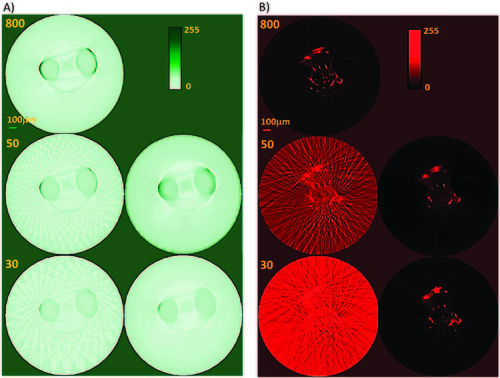
TraNac Tg(KDR:mCherry) zebrafish embryo 2D transaxial slices reconstructed from the densely sampled (800 projections) and down-sampled data sets of 50 and 30 projections using the conventional FBP method and iterative image reconstruction strategy. Zebrafish head slices reconstructed (A) from the transmission projection images using (left) the FBP algorithm and (right) the iterative image reconstruction strategy. (B) Slices reconstructed from the fluorescence projection images using (left) the FBP algorithm and (right) the iterative image reconstruction strategy. The number of projections used to reconstruct the images is indicated in each subfigure (left). Reconstructed slices are presented in a 0–255 contrast scale as indicated by the color bars. Scale bar pertains to all images. |

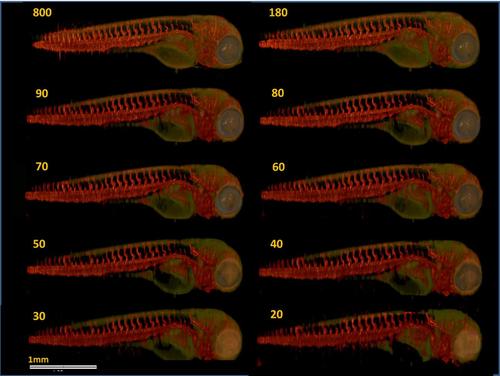
TraNac Tg(KDR:mCherry) zebrafish embryo anatomical [green] and segmented vasculature images [red] obtained from the under-sampled data sets. Anatomical and segmented vasculature images obtained from the transmission and fluorescence under-sampled data sets. The number of projections used to reconstruct the images and acquisition time is indicated in each subfigure. The vasculature labels (top left) indicate some of the key features of the zebrafish embryo vasculature: caudal vein (CV), caudal artery (CA), intersegmental vessel (SE), dorsal aorta (DA), posterior cardinal vein (PCV), dorsal longitudinal anastomotic vessel (DLAV), primary head sinus (PHS), dorsal longitudinal vein (DLV), inner optic circle (IOC) and nasal ciliary artery (NCA). Scale bar applies to all panels. |
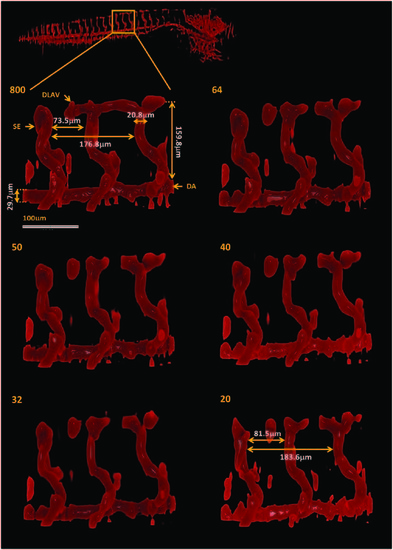
TraNac Tg(KDR:mCherry) zebrafish embryo magnified views of the segmented vasculature images obtained from the under-sampled data sets. The box indicates the region magnified (top left) The number of projections used to reconstruct the vasculature images is indicated in each subfigure (left). The vasculature labels indicate the intersegmental vessel (SE), dorsal aorta (DA) and dorsal longitudinal anastomotic vessel (DLAV). Scale bar applies to all magnified views. |
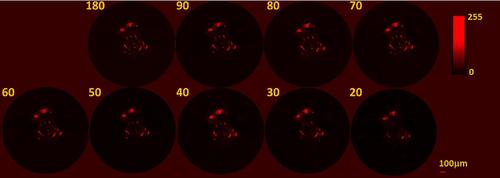
TraNac Tg(KDR:mCherry) zebrafish embryo images reconstructed from the down-sampled data set consisting of 50 fluorescence projections [red] using different algorithm parameters. Images reconstructed using (top) τ = 0.002, (middle) τ = 0.006 and (bottom) τ = 0.01 and (left) 5, (centre) 20 and (right) 40 TV iterations. The image that resulted in the highest SSIM is marked by the red square. However, no major differences are observed between the images. The transmission volumetric image [green] is displayed to provide an anatomical reference. Scale bar pertains to all images. |
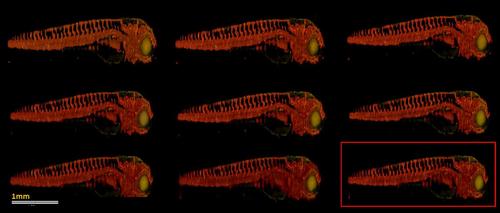
TraNac Tg(KDR:mCherry) zebrafish embryo anatomical [green] and vasculature [red] images reconstructed from the down-sampled data sets. The number of projections used to reconstruct the images is indicated in each subfigure. The quality of the images obtained from 800 projection with FBP is visually similar to those obtained with TwIST from at least 50 projections. Nevertheless, a large part of the vasculature network is still visible in the images obtained from less than 50 projection images. Scale bar pertains to all images. |
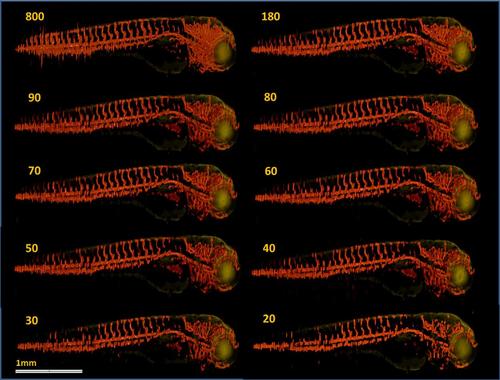
TraNac Tg(KDR:mCherry) zebrafish embryo segmented vasculature [red] obtained from the images reconstructed using the down-sampled data sets. The number of projections used to obtain the vasculature images is indicated in each image. The large majority of the blood vessels were detected by the segmentation algorithm. The transmission volumetric image [green] is displayed to provide an anatomical reference. |
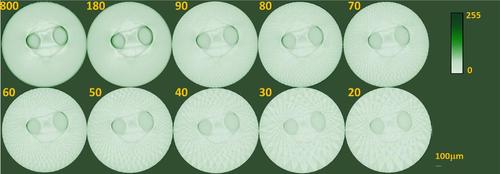
TraNac Tg(KDR:mCherry) zebrafish embryo 2D transaxial slices reconstructed from the densely sampled (800 projections) and down-sampled transmission data sets using the conventional FBP method. The number of projections used to reconstruct the images is indicated in each subfigure (left). Reconstructed slices are presented in a 0–255 contrast scale as indicated by the color bars. Scale bar pertains to all images. |
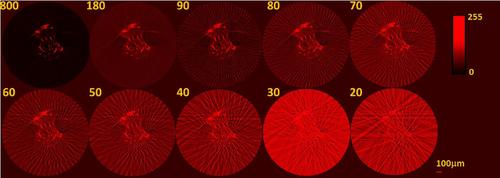
TraNac Tg(KDR:mCherry) zebrafish embryo 2D transaxial slices reconstructed from the densely sampled (800 projections) and down-sampled fluorescence data sets using the conventional FBP method. The number of projections used to reconstruct the images is indicated in each subfigure (left). Reconstructed slices are presented in a 0–255 contrast scale as indicated by the color bars. Scale bar pertains to all images. |

TraNac Tg(KDR:mCherry) zebrafish embryo 2D transaxial slices reconstructed from the densely sampled (800 projections) and down-sampled transmission data sets using the iterative reconstruction method. The number of projections used to reconstruct the images is indicated in each subfigure (left). Reconstructed slices are presented in a 0–255 contrast scale as indicated by the color bars. Scale bar pertains to all images. |
TraNac Tg(KDR:mCherry) zebrafish embryo 2D transaxial slices reconstructed from the densely sampled (800 projections) and down-sampled fluorescence data sets using the iterative reconstruction method. The number of projections used to reconstruct the images is indicated in each subfigure (left). Reconstructed slices are presented in a 0–255 contrast scale as indicated by the color bars. Scale bar pertains to all images. |