
FIGURE
Fig. 8
Fig. 8
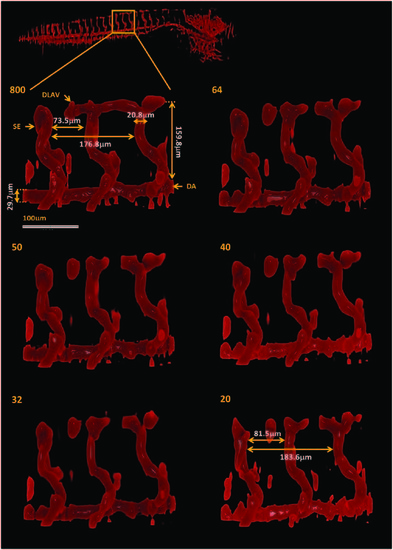
TraNac Tg(KDR:mCherry) zebrafish embryo magnified views of the segmented vasculature images obtained from the under-sampled data sets. The box indicates the region magnified (top left) The number of projections used to reconstruct the vasculature images is indicated in each subfigure (left). The vasculature labels indicate the intersegmental vessel (SE), dorsal aorta (DA) and dorsal longitudinal anastomotic vessel (DLAV). Scale bar applies to all magnified views. |
Expression Data
Expression Detail
Antibody Labeling
Phenotype Data
Phenotype Detail
Acknowledgments
This image is the copyrighted work of the attributed author or publisher, and
ZFIN has permission only to display this image to its users.
Additional permissions should be obtained from the applicable author or publisher of the image.
Full text @ PLoS One